Making Money on the Money Makers (Thats Banks for You Folks)
- Posted by Greg Harmon
- on April 13th, 2011
This morning JP Morgan, $JPM, announced earnings. The consensus was for them to earn $1.16 per share on $25.48 billion in revenue. They actually reported $1.28 per share on $25.8 billion in revenue and the stock is trading up about 45c at 47.09 as I write this. The chart coming into earnings shows that it had just come off yet another rejection at the long standing 47.80 resistance level. On Tuesday though it printed a long legged doji candle, signalling a potential reversal.
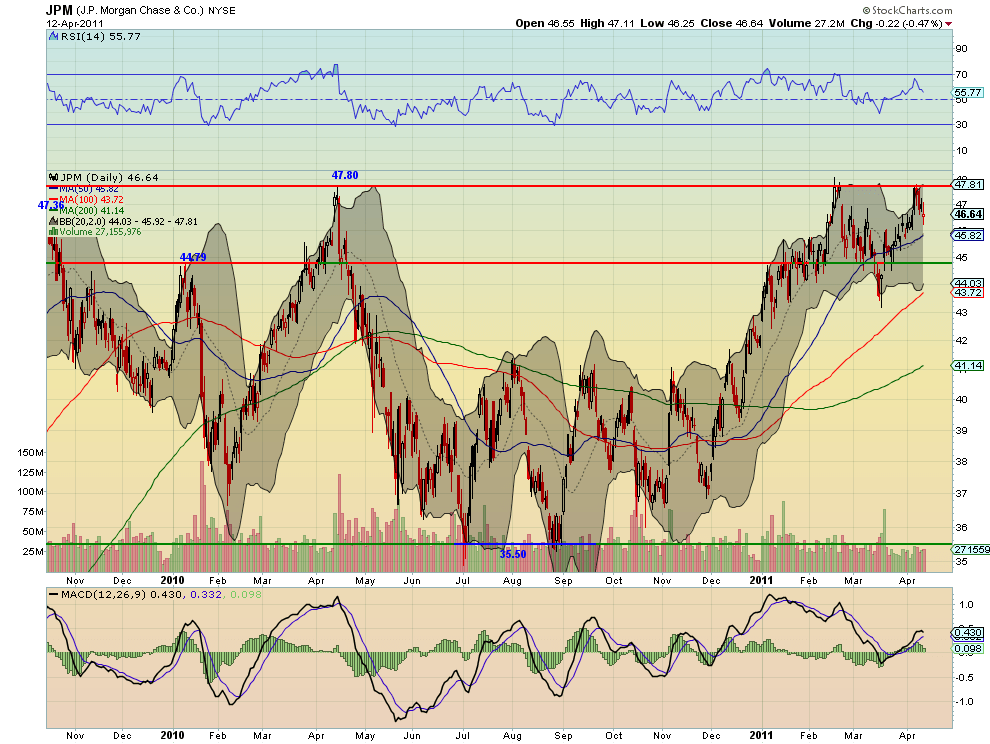
The Relative Strength Index (RSI) was was weakening and the Moving Average Convergence Divergence (MACD) indicator was declining and looks potentially headed for a bearish cross down. There is support at the 45.82-45.92 area. This is where the 50 day Simple Moving Average (SMA) and the mid line of the Bollinger bands are converging. Below that is the support/resistance line at 44.79 and then the area between the 100 day SMA and the lower Bollinger band from 43.72-44.03. To the up side there is that strong resistance at 47.80, and some at 47 on the way there. But there is a lot of room to run on the break of 47.80, what outside of a few days in October 2008, would be a 4 year high. If this pre-market activity holds it will confirm the doji as a reversal and look for a hold over 47.00 to test of the 47.80 resistance again.
But JPM is not the only bank stock reporting today. After the bell today Bank of the Ozarks, $OZRK reports. The chart for this stock looks great.

It was in an ascending triangle for the back half of 2010 before breaking it higher. The target for that break out is at 45.60 where it has found resistance the last few days. But it also spent some time consolidating in a range between 41.95 and 44.50 earlier this year before breaking the range higher last week. The target for this breakout is 47.05. The next target higher would be at 49.90 on a measured move comparable to the move from 37.80 to 44.20 in December 2010. It is testing support at the 44.50 break out level and has further support below at 43.48 and 43 before the channel bottom. The RSI looks to be rolling higher and the MACD is positive, but waning. As long as this holds the 44.50 level it looks good for higher prices.
As always you can see details of individual charts and more on my StockTwits feed and on chartly.)
If you like what you see above sign up for deeper analysis and trading strategy by using the Get Premium button above. As always you can see details of individual charts and more on my StockTwits page.
The information in this blog post represents my own opinions and does not contain a recommendation for any particular security or investment. I or my affiliates may hold positions or other interests in securities mentioned in the Blog, please see my Disclaimer page for my full disclaimer.
blog comments powered by Disqus
-
 Gregory W. Harmon CMT, CFA, has traded since 1986 and held senior positions including Head of Global Trading, Head of Product Development, Head of Strategy and Director of Equity. (More)
 -
Subscribe to Dragonfly Capital Views
Lifetime Subscription
$4,000.00Sign upAnnual Subscription
$1,000.00Sign upQuarterly Subscription
$350.00Sign up
Recent Posts
- Bull Scan for 10-13-26
- Premium Earnings 10-12-26: Citigroup and Johnson & Johnson
- 4 Trade Ideas Wells Fargo: Bonus Idea
- 5 Trade Ideas for Monday: AbbVie, Airbnb, Affirm, GE Aerospace and Walmart
- Top Trade Ideas for the Week of October 12, 2026: The Rest Premium
- Top Trade Ideas for the Week of October 12, 2026: The Best
- SPY Trends and Influencers October 10, 2026
- Macro Week in Review/Preview October 9, 2026
- Bull Scan for 10-12-26
- How this Week’s Premium Top 10 Performed, October 9, 2026
Archives