Show Me the CarMax
- Posted by Greg Harmon
- on March 31st, 2011
CarMax (ticker:$KMX) just reported earnings and beat street estimates. But the price action on the chart seems to have anticipated this beat. It had been in a descending triangle, with a base at 31.40, from mid February and broke out above that on Tuesday, driving through and finishing above both the 100 day and 50 day Simple Moving Averages (SMA’s). At the same time the Relative Strength Index (RSI) turned sharply higher and the Moving Average Convergence Divergence (MACD) indicator crossed bullishly positive.
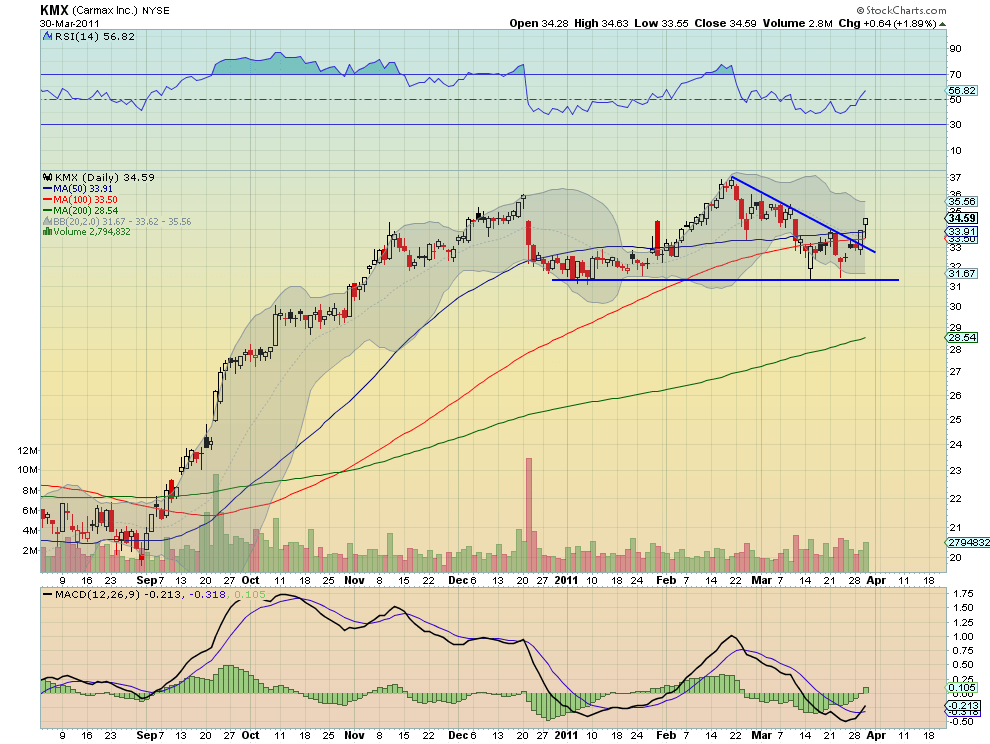
Now that it has beat, the path higher gets another cheerleader in its camp. The next level of resistance comes at previous resistance of 36 from mid December and earlier in March. Followed by the previous peak at 37 February 18th. If it can get through those levels then the target for the break out of the triangle is next at 38.75. Getting long the stock with a stop at the 50 SMA at 33.91 (roughly 2%) gives a reward to risk ratio of 6:1 with a target gain of about 12% if you can get in at yesterday’s closing level. Maybe enough to buy a used car from them.
Good luck and trade’m well.
As always you can see details of individual charts and more on my StockTwits feed and on chartly.)
If you like what you see above sign up for deeper analysis and trading strategy by using the Get Premium button above. As always you can see details of individual charts and more on my StockTwits page.
The information in this blog post represents my own opinions and does not contain a recommendation for any particular security or investment. I or my affiliates may hold positions or other interests in securities mentioned in the Blog, please see my Disclaimer page for my full disclaimer.
blog comments powered by Disqus
-
 Gregory W. Harmon CMT, CFA, has traded since 1986 and held senior positions including Head of Global Trading, Head of Product Development, Head of Strategy and Director of Equity. (More)
 -
Subscribe to Dragonfly Capital Views
Lifetime Subscription
$4,000.00Sign upAnnual Subscription
$1,000.00Sign upQuarterly Subscription
$350.00Sign up
Recent Posts
- Bull Scan for 10-13-26
- Premium Earnings 10-12-26: Citigroup and Johnson & Johnson
- 4 Trade Ideas Wells Fargo: Bonus Idea
- 5 Trade Ideas for Monday: AbbVie, Airbnb, Affirm, GE Aerospace and Walmart
- Top Trade Ideas for the Week of October 12, 2026: The Rest Premium
- Top Trade Ideas for the Week of October 12, 2026: The Best
- SPY Trends and Influencers October 10, 2026
- Macro Week in Review/Preview October 9, 2026
- Bull Scan for 10-12-26
- How this Week’s Premium Top 10 Performed, October 9, 2026
Archives