The Skinny Girl is Picking a Fight with the Fat Boy
- Posted by Greg Harmon
- on March 23rd, 2011
I think this is the most natural pairs trade ever. Fitness vs Calories. Healthy living vs Living Big. The Groove Pant vs the Big Mac. Yoga, Pilates, vs the Dollar menu. Lululemon (ticker: $LULU) vs McDonalds (ticker: $MCD). How can you be agnostic to Hottie’s versus Heavy’s? You have to be on one side or the other. So in this smack down who has the edge? Let’s look at the charts.
The Heavyweight Champ

The chart for McDonalds shows above shows improving technicals. After its December plunge it has found support twice at the 200 day Simple Moving Average (SMA). With a rising Relative Strength Index (RSI) and improving Moving Average Convergence Divergence (MACD) indicator it now looks to be heading higher. If it can get through the 50 day SMA then there is resistance at 75.90 and then 76.94. A bit leaner now and looks good for the fight. What about the contender.
The Contender

The chart for Lululemon shows the fall after earnings to the 50 day SMA which it has been riding ever since. The RSI is now turning up and the MACD is about to turn positive as the Bollinger bands are squeezing. All the SMA’s are sloping higher. This also looks ready to rumble. So who has the edge.
The Tale of the Tape
The ratio chart below shows a symmetrical triangle forming over the 50 day SMA. Currently the ratio at 1.06 is smack dab in the middle with the upper rail at 1.10 and the lower rail at 0.99. But the RSI is sloping and pointing higher and the MACD is improving. Also note that the trend longer term has been higher with all the SMA’s sloping up. Give the early lead to LULU, but it needs to break out to declare a winner. Keep watching as it plays out and ready the pairs trade below.
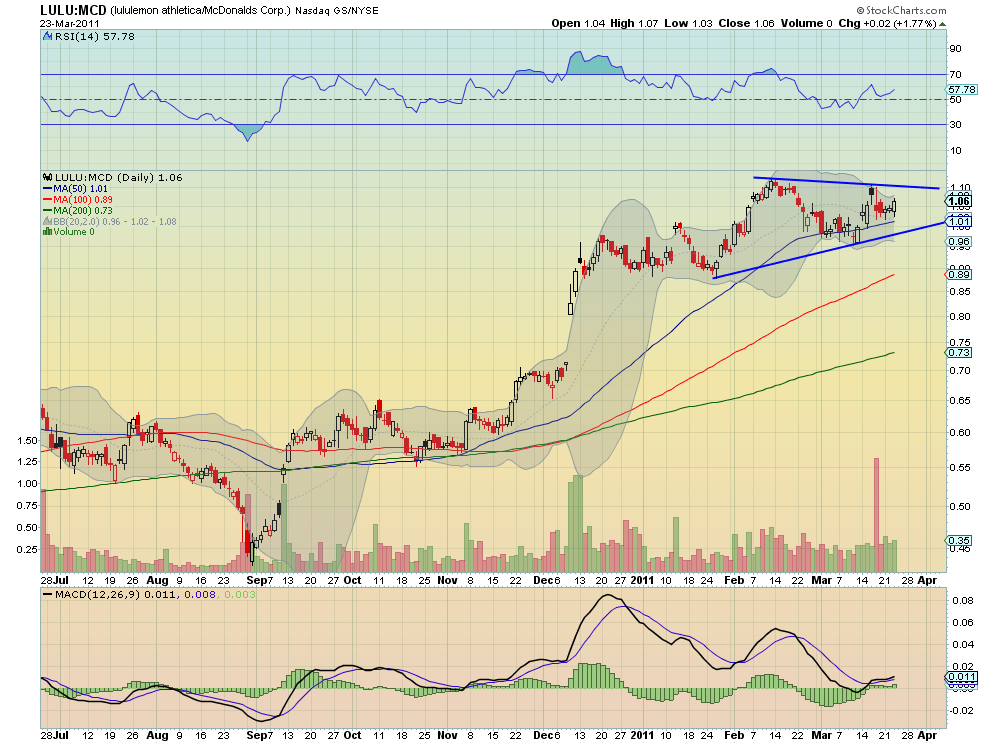
On a move of the ratio over 1.1 (over the top rail) buy 1,000 LULU and sell short 1,000 MCD. Use a stop just below the break out point. Resistance will come at 1.13 and the pattern projects a target of 1.34, or 0.24 above the breakout level.
On a move below the ratio of 0.99 (below the bottom rail) sell short 1,000 LULU and buy 1,000 MCD. Use a stop just above the break down point. Support will come at will come at 0.89 and 0.80 before the gap to 0.71. The pattern projects a target of 0.75, or 0.24 below the breakout level.
(As always you can see details of individual charts and more on my StockTwits feed and on chartly.)
If you like what you see above sign up for deeper analysis and trading strategy by using the Get Premium button above. As always you can see details of individual charts and more on my StockTwits page.
The information in this blog post represents my own opinions and does not contain a recommendation for any particular security or investment. I or my affiliates may hold positions or other interests in securities mentioned in the Blog, please see my Disclaimer page for my full disclaimer.
blog comments powered by Disqus
-
 Gregory W. Harmon CMT, CFA, has traded since 1986 and held senior positions including Head of Global Trading, Head of Product Development, Head of Strategy and Director of Equity. (More)
 -
Subscribe to Dragonfly Capital Views
Lifetime Subscription
$4,000.00Sign upAnnual Subscription
$1,000.00Sign upQuarterly Subscription
$350.00Sign up
Recent Posts
- Bull Scan for 10-13-26
- Premium Earnings 10-12-26: Citigroup and Johnson & Johnson
- 4 Trade Ideas Wells Fargo: Bonus Idea
- 5 Trade Ideas for Monday: AbbVie, Airbnb, Affirm, GE Aerospace and Walmart
- Top Trade Ideas for the Week of October 12, 2026: The Rest Premium
- Top Trade Ideas for the Week of October 12, 2026: The Best
- SPY Trends and Influencers October 10, 2026
- Macro Week in Review/Preview October 9, 2026
- Bull Scan for 10-12-26
- How this Week’s Premium Top 10 Performed, October 9, 2026
Archives