Hollow Red Rubber (Bollinger) Band Plays in Insurance
- Posted by Greg Harmon
- on March 15th, 2011
Insurance company stocks fell with the market early Tuesday on the worsening situation in Japan overnight. By the end of the day the market had recovered most of its losses but the insurance companies were still in the red. The Hollow Red that is. A Hollow Red candle is distinct because it shows intraday bullish price action, although the stock finished lower (More on Hollow Reds below). Is this a buying opportunity or is there further downside to come? Let’s look at the charts of three, Aflac, Hartford Financial and Prudential Financial for ideas.
Aflac, Ticker:$AFL
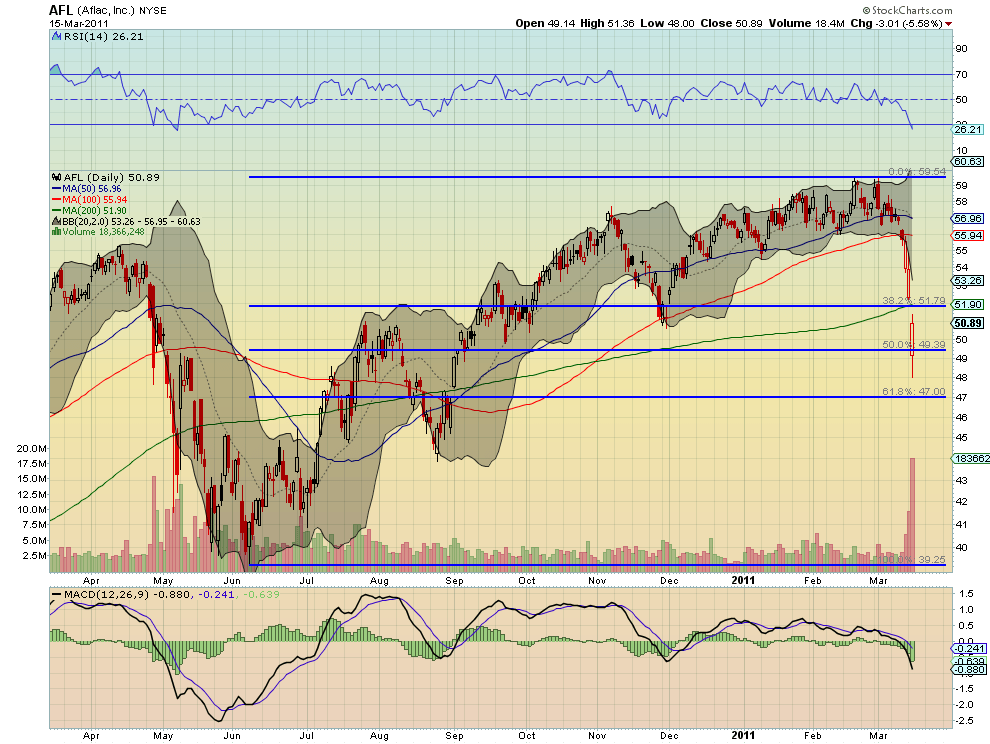
Only two weeks ago Aflac looked ready to break out higher. From that point it has fallen 20% and now stands about 15% lower. Tuesday’s action retraced over 50% of the move up from June and leaves it below the 200 day Simple Moving Average (SMA). Although not quite a Hammer, the bullish Hollow Red candle finished well below the Bollinger bands. With a stop at the 50% retracement level at 49.39 this could be played for a short term bounce to the 53.26 area. The Relative Strength Index (RSI) and Moving Average Convergence Divergence (MACD) indicator are both rather bearish indicating more downside though. Until they reverse or level this should only be a day trade.
Hartford Financial, Ticker:$HIG

Hartford has been in a downtrend for a month that was accelerated with the events in Japan. The Hollow Red candle printed today was a tight bullish Hammer reversal with a long shadow. A Hammer should be confirmed before signaling a reversal. This also finished outside of the Bollinger bands. A bounce play to get it back inside them at 26.22 can be taken for a trade with a stop placed just under the real body of the candle at about 25.40. With the RSI and MACD looking bearish this trade should also be short term. Until they reverse the trend is still down.
Prudential Financial, Ticker:$PRU
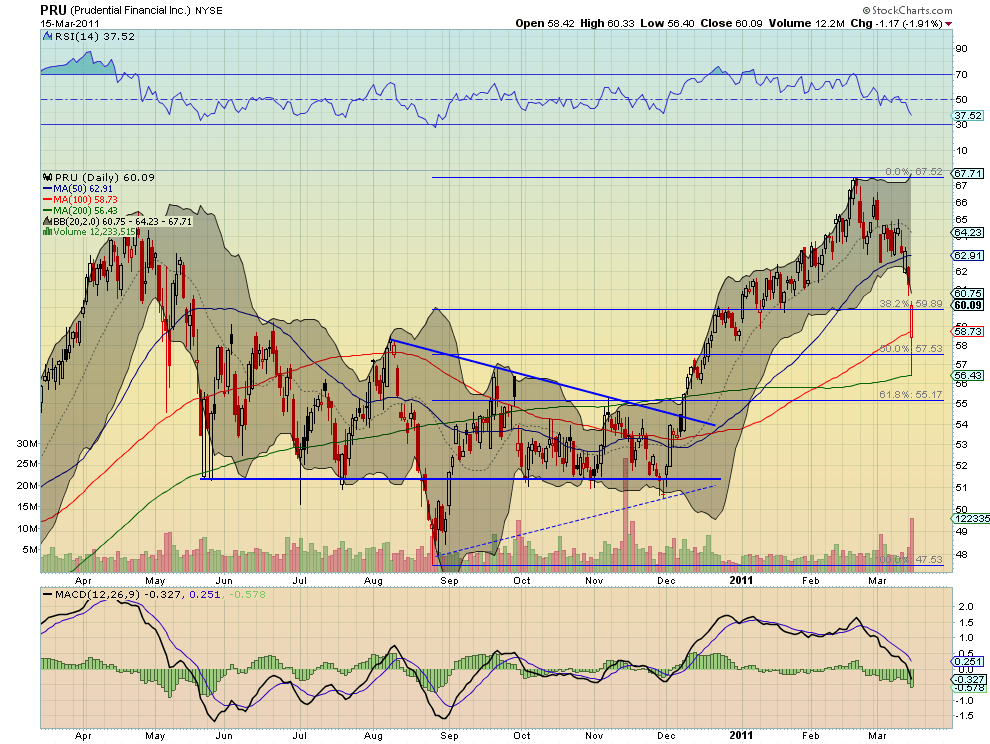
Prudential has also been in a one month down trend. Tuesday it printed a bullish Hammer candle that was Hollow and Red, that tested the 200 day SMA and through the 50% retracement of the up move. Remembering that Hammers should be confirmed before they signal a reversal, note that this is also outside of the Bollinger bands. The bounce play on PRU is looking for a move higher to 60.75 or more with a stop under the open Tuesday at 58.35. The RSI and MACD here are bearish so keep it short term.
All of these plays are speculative. Just because the price is outside of the Bollinger bands does not mean it has to move immediately back inside. In fact in all three of these charts the Bollinger bands are expanding so the targets listed may not be achieved while price still moves within the bands again. Keep close attention and stick to day trades. From a sentiment perspective, the willingness for long holders to continue to hold will fluctuate with changes in the perceived financial risk, as the nuclear reactor situation resolves. Good luck and trade’m well.
As always you can see details of individual charts and more on my StockTwits feed and on chartly.)
If you like what you see above sign up for deeper analysis and trading strategy by using the Get Premium button above. As always you can see details of individual charts and more on my StockTwits page.
The information in this blog post represents my own opinions and does not contain a recommendation for any particular security or investment. I or my affiliates may hold positions or other interests in securities mentioned in the Blog, please see my Disclaimer page for my full disclaimer.
blog comments powered by Disqus
-
 Gregory W. Harmon CMT, CFA, has traded since 1986 and held senior positions including Head of Global Trading, Head of Product Development, Head of Strategy and Director of Equity. (More)
 -
Subscribe to Dragonfly Capital Views
Lifetime Subscription
$4,000.00Sign upAnnual Subscription
$1,000.00Sign upQuarterly Subscription
$350.00Sign up
Recent Posts
- Bull Scan for 10-13-26
- Premium Earnings 10-12-26: Citigroup and Johnson & Johnson
- 4 Trade Ideas Wells Fargo: Bonus Idea
- 5 Trade Ideas for Monday: AbbVie, Airbnb, Affirm, GE Aerospace and Walmart
- Top Trade Ideas for the Week of October 12, 2026: The Rest Premium
- Top Trade Ideas for the Week of October 12, 2026: The Best
- SPY Trends and Influencers October 10, 2026
- Macro Week in Review/Preview October 9, 2026
- Bull Scan for 10-12-26
- How this Week’s Premium Top 10 Performed, October 9, 2026
Archives