Awful and Amazing News: Amazon Anxiety Option Opportunity
- Posted by Greg Harmon
- on March 14th, 2011
The tax web is tightening on Amazon (ticker:$AMZN) as it is now adding Illinois to the list of states it will not do physical business in. At the same time pundits are claiming that it will benefit from more online shopping due to high oil prices. Good news and bad news. This push pull is reflected in its chart as well. The daily chart below has been in a downtrend since mid February, but appears it may be reversing with a strong move, towards the 171.35 Fibonacci level, printing a bullish engulfing candle Friday.
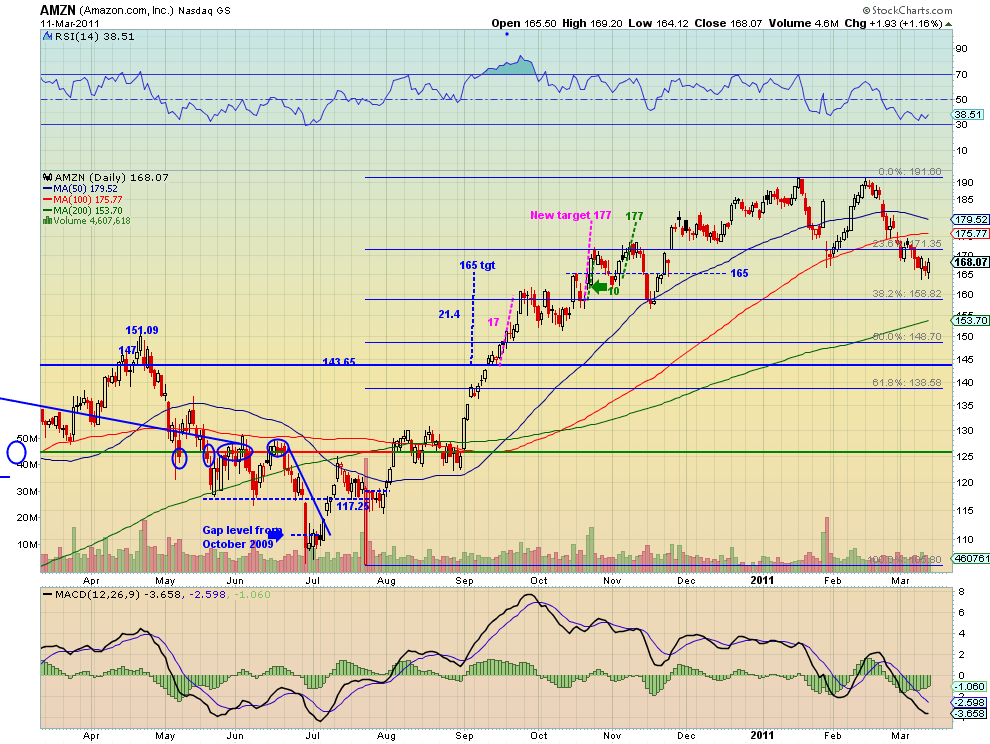
Other indicators, the Relative Strength Index (RSI) and the Moving Average Convergence Divergence (MACD) indicator, have stopped getting worse and are improving as well. Perhaps 165 will hold as support. Beware of the lower Fibonacci level at 158.82 though if 165 fails. The weekly chart also shows that downtrend the last few candles. The RSI and MACD on this chart though still point to more downside. It does not mean that the price cannot reverse higher though, with the other indicators giving the opposite read, they are indicators not rules. And the candle for this week printed a bullish Hammer reversal.

If you believe a reversal is in store then you can play this with little capital by buying an April 170/180 call spread for about $3.60, based on Friday closing prices. This allows you to participate in upside moves and collect 10 if the stock closes at or above 180 on April 15. That is nearly a 3:1 reward to risk ratio and can be improved further by placing a stop loss on the spread just under $3.00. For the aggressive trader you could reduce this cost of the spread by also selling an April 155 put for a $2.65 credit, making the net cost less than $1, but also exposing yourself to downside price risk below a close at 155 on April 15. If that happens you can either be happy that you were put the stock at a net under 156.00 or buy back the put. The chart shows that 158.82 is a key Fibonacci level on the last short burst higher and 154.57 an important support from the longer term run up from the bottom in November 2009.
(As always you can see details of individual charts and more on my StockTwits feed and on chartly.)
If you like what you see above sign up for deeper analysis and trading strategy by using the Get Premium button above. As always you can see details of individual charts and more on my StockTwits page.
The information in this blog post represents my own opinions and does not contain a recommendation for any particular security or investment. I or my affiliates may hold positions or other interests in securities mentioned in the Blog, please see my Disclaimer page for my full disclaimer.
blog comments powered by Disqus
-
 Gregory W. Harmon CMT, CFA, has traded since 1986 and held senior positions including Head of Global Trading, Head of Product Development, Head of Strategy and Director of Equity. (More)
 -
Subscribe to Dragonfly Capital Views
Lifetime Subscription
$4,000.00Sign upAnnual Subscription
$1,000.00Sign upQuarterly Subscription
$350.00Sign up
Recent Posts
- Bull Scan for 10-13-26
- Premium Earnings 10-12-26: Citigroup and Johnson & Johnson
- 4 Trade Ideas Wells Fargo: Bonus Idea
- 5 Trade Ideas for Monday: AbbVie, Airbnb, Affirm, GE Aerospace and Walmart
- Top Trade Ideas for the Week of October 12, 2026: The Rest Premium
- Top Trade Ideas for the Week of October 12, 2026: The Best
- SPY Trends and Influencers October 10, 2026
- Macro Week in Review/Preview October 9, 2026
- Bull Scan for 10-12-26
- How this Week’s Premium Top 10 Performed, October 9, 2026
Archives