Macro Week in Review/Preview March 5, 2011
- Posted by Greg Harmon
- on March 5th, 2011
Last week’s review of the macro market indicators looked to bring more upside for Gold and Oil. The US Dollar Index was still in critical territory on long term support and looking lower with US Treasuries looking stronger still. Both the Chinese and Emerging markets were set up to continue lower. The Volatility Index was poised to drift in a wider range but not expected to move materially higher. The US Equity ETF’s, SPY, IWM and QQQQ, all looked to continue their uptrends but with caution advised for a possible confirmation of the Hanging Man printed on the weekly charts to continue a short term correction.
The week began with Gold and Oil moving to new highs and both finishing higher. The US Dollar Index continued the drift lower, but US Treasuries found resistance and moved lower. China and Emerging markets drifted higher. The Volatility Index behaved as expected, and US Equity ETF’s bounced in a range ending close to unchanged. How does this impact the view for next week? Let’s look at some charts.
As always you can see details of individual charts and more on my StockTwits feed and on chartly.)
Gold Daily
Gold Weekly

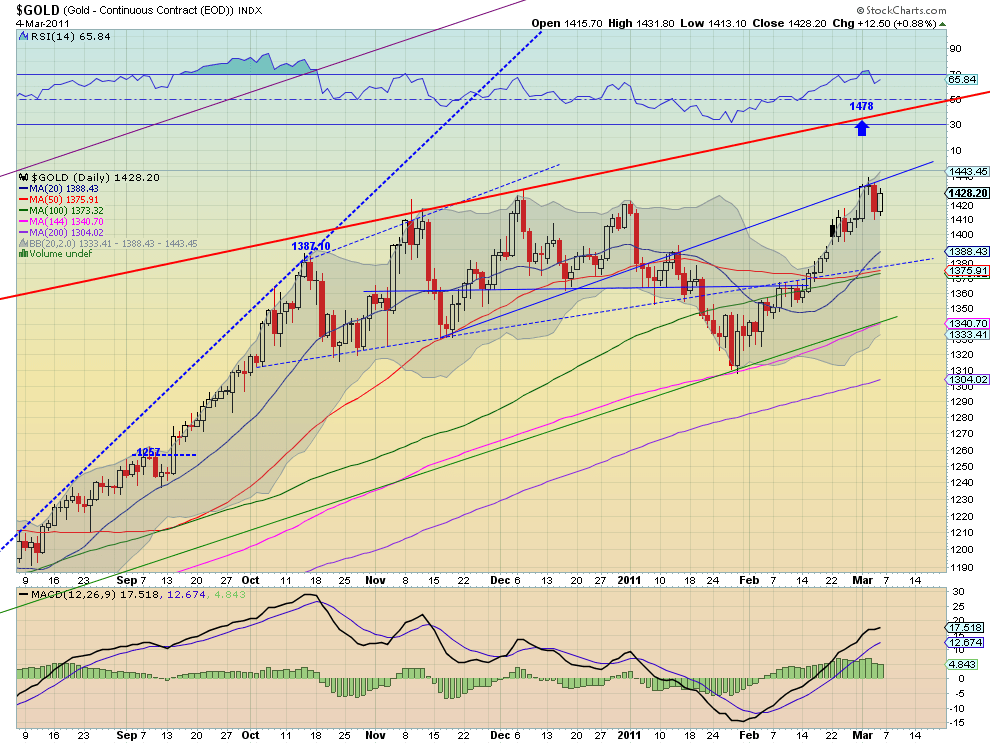
The daily chart for Gold shows it racing higher until meeting resistance at the extension of the trend line support from November and December, making new highs. It is holding now above 1411 support and consolidating with an inside day Friday. Note that it did make a lower low and a higher high during this run, a potential topping indicator that will need to be watched going forward. The Relative Strength Index (RSI) is firmly in bullish territory and now pointing higher, but the Moving Average Convergence Divergence (MACD) indicator is starting to fade. the Weekly chart looks very bullish, following last weeks Doji with a upward move. The RSI is rising and the MACD is nearly back to zero and crossing higher. The expanding Bollinger bands willow it to move higher toward the resistance at 1484. Expect Gold to move higher with the short term potential of a pullback to test 1400.
West Texas Intermediate Crude Daily
West Texas Intermediate Crude Weekly

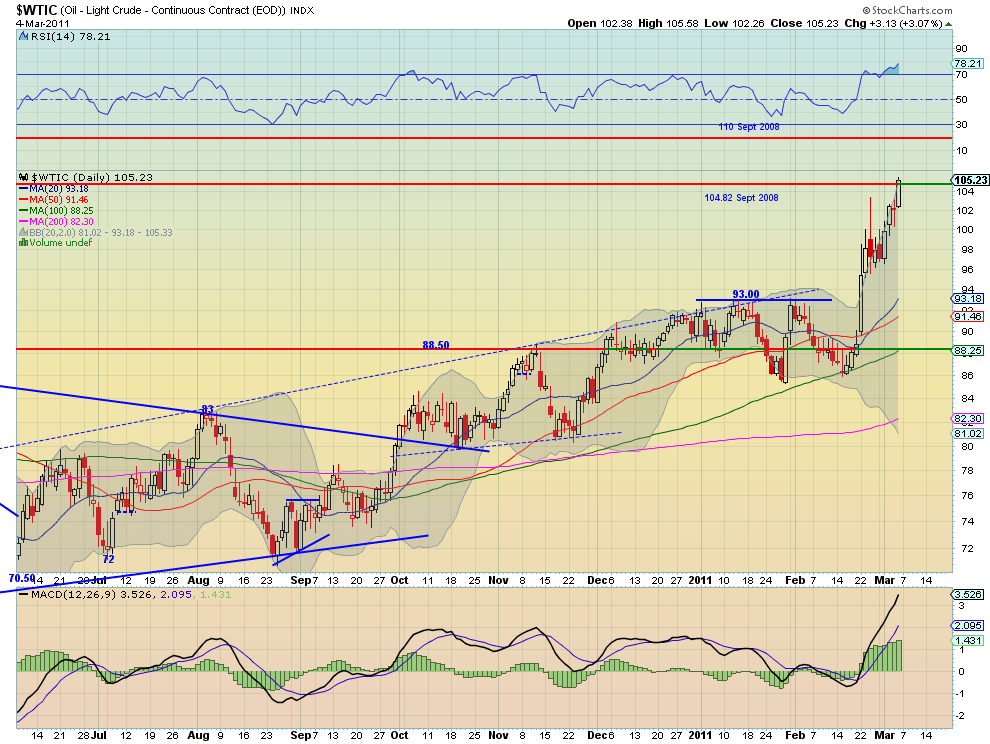
Crude Oil broke out if the bull flag higher this week ending on the highs near resistance of the 61.8% retracement of the 2008 move down from the spike. The daily chart shows a strong MACD and an RSI strongly in bullish territory. Support now comes at 100 and the next level higher at 110. Moving to the weekly chart shows the same strength. The RSI is rising and the MACD is increasing as it moved higher. There is a band of resistance next on the weekly at the 107 to 109 area and then 115 through 120. The Bollinger bands are expanding as it moves higher as well. Expect the first resistance band to be tested very soon.
US Dollar Index Daily
US Dollar Index Weekly
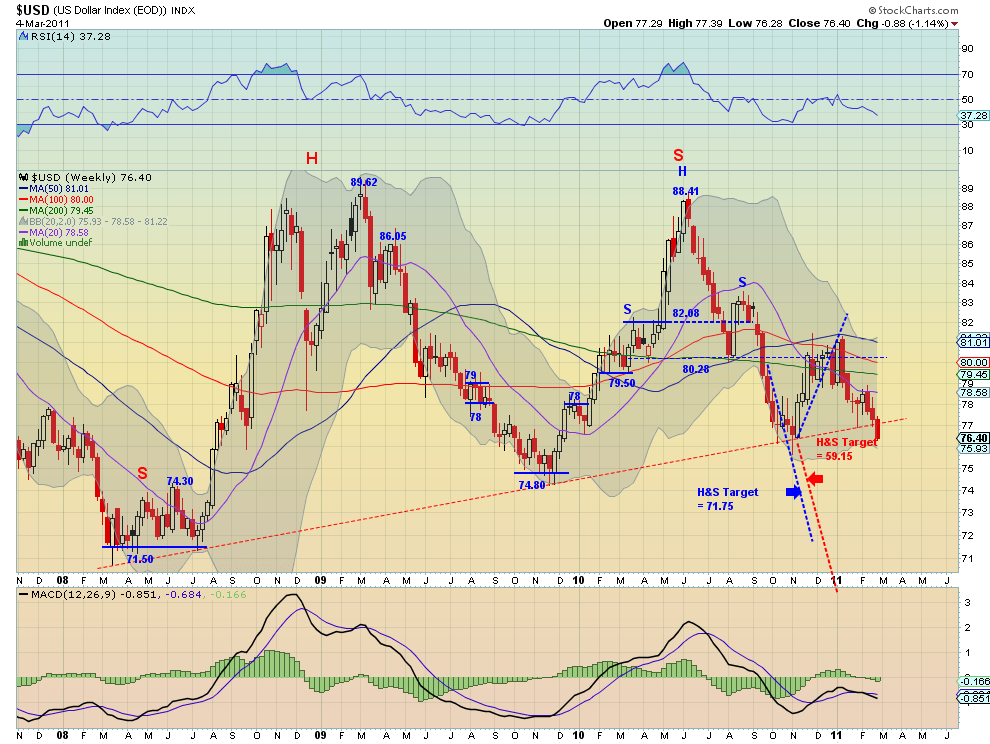
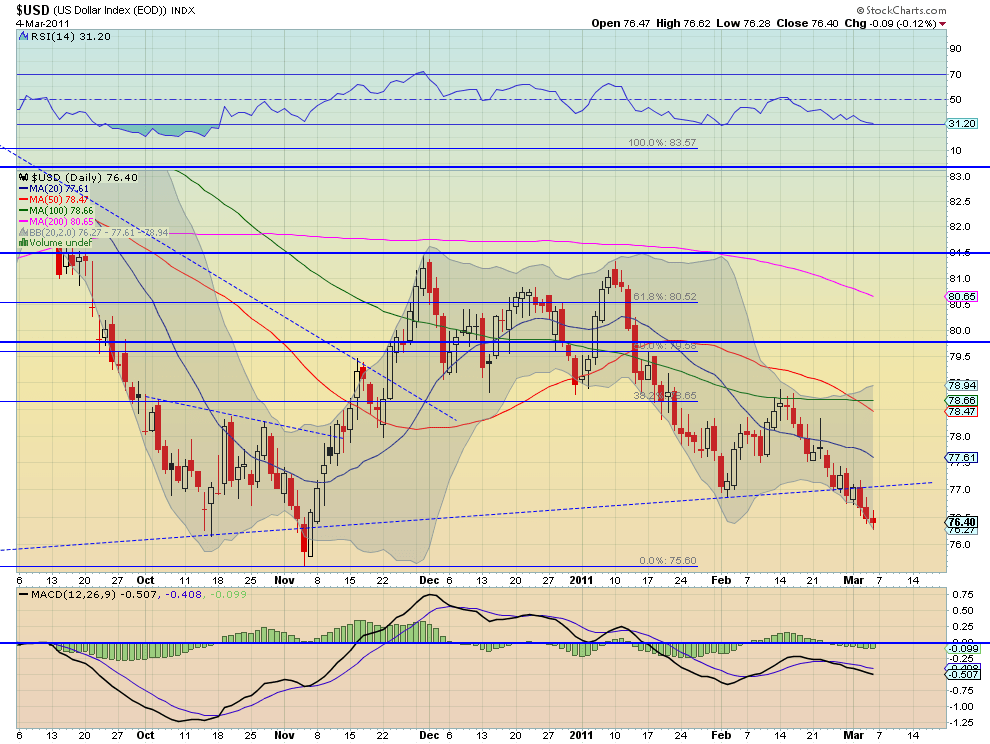
The US Dollar Index continued its march lower through the 3 year uptrend line of support with only a minor stall. The RSI on the daily chart is moving lower and the MACD is is growing more negative, as the expanding Bollinger bands are facilitating a further decline. On the weekly chart the Index looks even worse. It is sitting on support at 76.40 where it printed a reversal candle to start November, but this time it got there with a big red candle closing near the low. The next support comes at the base from October and November of 2009 at 74.80 and then the base in 2008 at 71.50, which would complete the smaller Head and Shoulders pattern (in blue). A re-test of the uptrend at 77.11 is possible but it seems more likely that it just continues lower.
iShares Barclays 20+ Yr Treasury Bond Fund Daily

iShares Barclays 20+ Yr Treasury Bond Fund Weekly
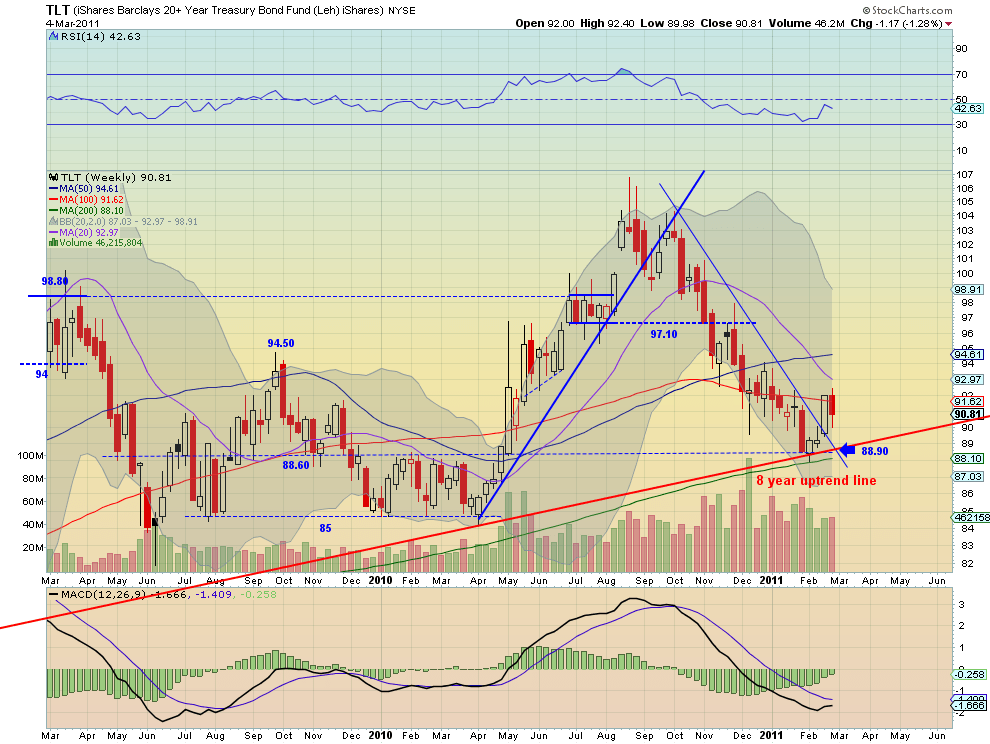
US Treasuries, measured by the TLT, pulled back as they met resistance at 92.28 the top of the consolidation range from January. They held support near the bottom of that range coincident with the 20 day Simple Moving Average (SMA). The RSI is holding at the mid line but the MACD is decreasing and looks to cross lower on the daily chart, suggesting more downside. The weekly chart looks more positive with the pullback still above the middle of the previous week strength. The MACD is improving but the RSI may be reversing short term after moving higher. If it continues to hold over the 20 day SMA then it can work higher to resistance at 93. If not then a retest of the 8 year uptrend on the weekly chart at 88.90 seems likely.
Shanghai Stock Exchange Composite Daily

Shanghai Stock Exchange Composite Weekly

The Shanghai Composite found support at the 100 day SMA and bounced higher this week, to near the resistance area of 2950 to 2965. The RSI on the daily chart is in bullish territory and the MACD kissed and looks to have avoided a cross. The peak at 3150 is the next resistance area. The weekly chart looks very strong. It has moved out of the symmetrical triangle higher and is now heading towards the 3050 resistance level. The RSI is rising and the MACD is just starting to move higher. Don’t expect the explosive move that can happen out of a symmetrical triangle as this break out was very near the apex, but more of a slow and steady rise.
iShares MSCI Emerging Markets Index Daily

iShares MSCI Emerging Markets Index Weekly

Emerging markets broke the expanding downward channel on the daily chart and closed above the cluster of the 20, 50 and 100 day SMA’s. It printed a doji, signaling indecision, at the top of the Bollinger bands Friday, so it might retrace the gap. But the RSI is now firmly in bullish territory and pointing higher and the MACD increasing. These suggest a move higher. On the weekly chart the it is clearer to see that the Bollinger bands are starting to expand as it moved higher confirming last week’s Hammer print. Over 48.10 and it can start a run to the Measured Move (MM) target of 58.60. Watch for the MACD to turn positive and the RSI on the weekly to continue higher as a signal the move is happening.
VIX Daily

VIX Weekly

The Volatility Index had its second wider range week in a row, finding support at the leveling 100 day SMA on the daily chart. The Shorter SMA’s are now starting to turn up, and the RSI has bounced off of the mid line twice, so a rise in the VIX is something to watch for. Any jump though seems to be bounded by the 200 day SMA and the 24 area just above that. The weekly chart shows a second long legged Doji between the 20 and 50 week SMA’s. The RSI has not been able to pierce the mid line yet on the weekly but is sloped steeply so it could happen this time. The MACD is starting to increase as well. Support remains under these SMA’s at 15.50 to 15.67, but look for more testing to the upside in the short run.
SPY Daily

SPY Weekly
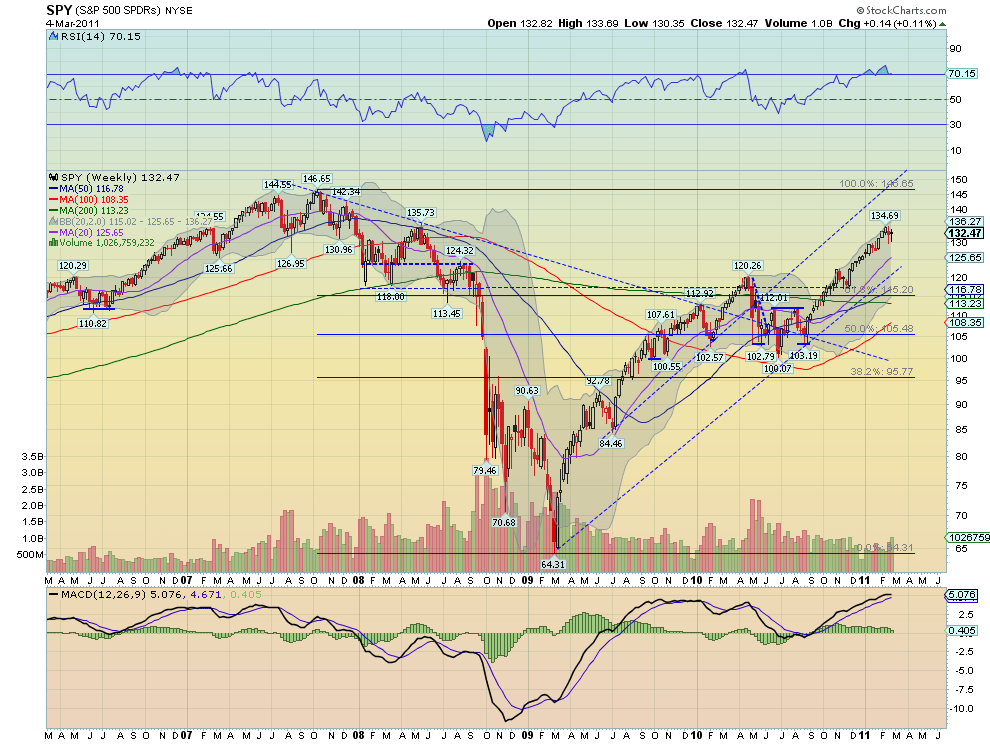
The SPY broke below the uptrend support line from September this week but finished right back at it and on the 20 day SMA. Volume remained higher most of the week, with even higher volume on the down days. The RSI is still in bullish territory but looks to test the mid line again. The MACD is negative, but leveling. The daily picture is mixed and leads to an expectation of more of the same in the short run. The weekly chart printed a second Hanging Man, in a tighter range. With an elevated RSI and a MACD that is falling and perhaps heading for a cross, it looks like further consolidation or some downside, within the long uptrend, on the weekly chart. So sideways to down for the near term for the SPY
IWM Daily

IWM Weekly
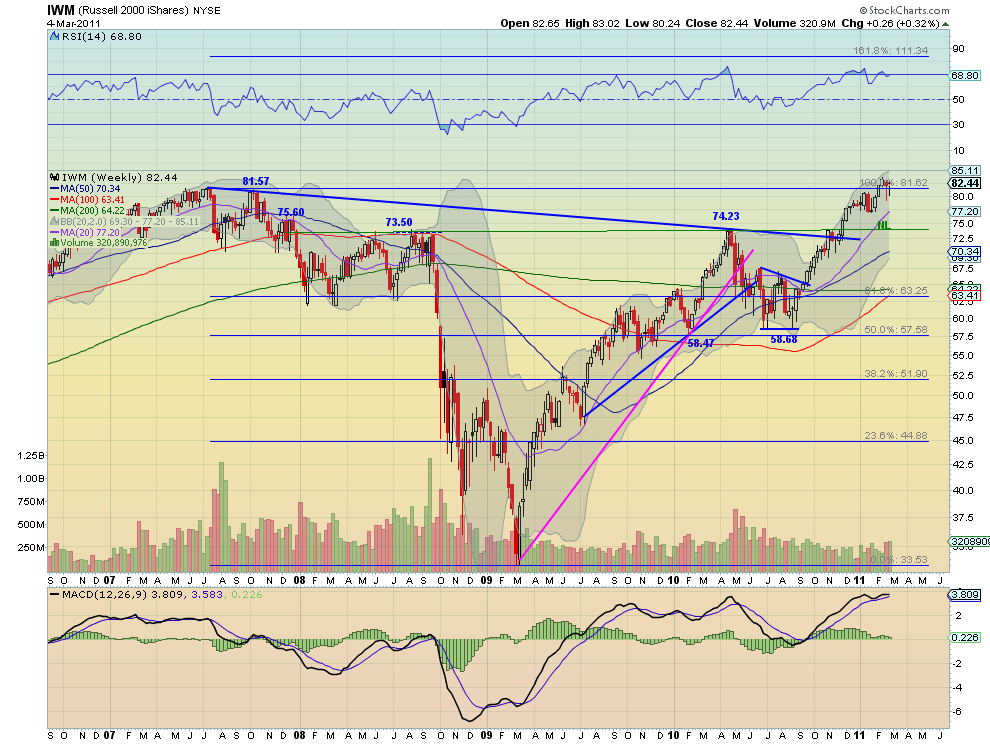
The IWM looks a little better than the SPY, but not by much. It also broke the 20 day SMA and then finished above it, with a bullish RSI that may retest the mid line and a MACD that is improving, but negative. What makes it slightly better is that since the pullback began IWM has now put in a higher low and ending this week, a higher high, on the daily chart, even if it continues down to the 20 SMA again. The weekly chart printed a second Hanging Man in a tighter range. With an elevated RSI and a MACD that is falling and perhaps heading for a cross, it looks like further consolidation or some downside, within the long uptrend, on the weekly chart. So sideways to down for the near term for the IWM as well.
QQQQ Daily

QQQQ Weekly

Like the IWM the QQQQ also printed a higher low and now a higher high within this pullback. it is resting on the 20 day SMA as support and with a bullish RSI that may retest the mid line and a MACD that is improving, but negative. The weekly chart printed a second Hanging Man for QQQQ also. With an elevated RSI and a MACD that is falling and perhaps heading for a cross, it looks like further consolidation or some downside, within the long uptrend, on the weekly chart. So sideways to down for the near term for the QQQQ as well.
So the short term looks to bring new highs for Gold and Oil, with a chance of consolidation within the coming week. The US Dollar Index looks to be headed lower with US Treasuries fate determined by the 20 and 50 day SMA’s. Chinese and Emerging markets look better bid. The Volatility Index appears to be drifting higher with a broader range creating some uncertainty with the broad market Equity ETF’s. The SPY, IWM and QQQQ all look like they have more consolidation in store for them this with a bias to the downside, although within the context of a continued strong uptrend. Use this information about the major trends and their influencers to help plan the week ahead and trade’m well.
If you like what you see above sign up for deeper analysis and trading strategy by using the Get Premium button above. As always you can see details of individual charts and more on my StockTwits page.
The information in this blog post represents my own opinions and does not contain a recommendation for any particular security or investment. I or my affiliates may hold positions or other interests in securities mentioned in the Blog, please see my Disclaimer page for my full disclaimer.
blog comments powered by Disqus
-
 Gregory W. Harmon CMT, CFA, has traded since 1986 and held senior positions including Head of Global Trading, Head of Product Development, Head of Strategy and Director of Equity. (More)
 -
Subscribe to Dragonfly Capital Views
Lifetime Subscription
$4,000.00Sign upAnnual Subscription
$1,000.00Sign upQuarterly Subscription
$350.00Sign up
Recent Posts
- Bull Scan for 10-13-26
- Premium Earnings 10-12-26: Citigroup and Johnson & Johnson
- 4 Trade Ideas Wells Fargo: Bonus Idea
- 5 Trade Ideas for Monday: AbbVie, Airbnb, Affirm, GE Aerospace and Walmart
- Top Trade Ideas for the Week of October 12, 2026: The Rest Premium
- Top Trade Ideas for the Week of October 12, 2026: The Best
- SPY Trends and Influencers October 10, 2026
- Macro Week in Review/Preview October 9, 2026
- Bull Scan for 10-12-26
- How this Week’s Premium Top 10 Performed, October 9, 2026
Archives