Stoking The Coals
- Posted by Greg Harmon
- on February 18th, 2011
Coal stocks have been smoldering over the last few weeks but it looks someone is pouring some lighter fluid on them now. There are a lot of names in this space so which is the best play. Let’s look at a few.
Market Vectors – Coal ETF, Ticker: KOL

The easiest way to avoid comparing the many companies in this sector is to look at the ETF for coal, KOL. It has recorded the pullback in recent weeks but has held support several times at 45.34, the bottom rail of a descending triangle pattern. It is now testing resistance at the top of that triangle. If it can get through look for a retest of the previous high at 49.80 on the way to a target move from the pattern of 51.25. The Relative Strength Index (RSI) has been bumping along the mid line, not giving up the bullish territory and the Moving Average Convergence Divergence (MACD) indicator has been improving and is about to bullishly cross up, both supporting an attempt to break out higher.
James River Coal, Ticker: JRCC
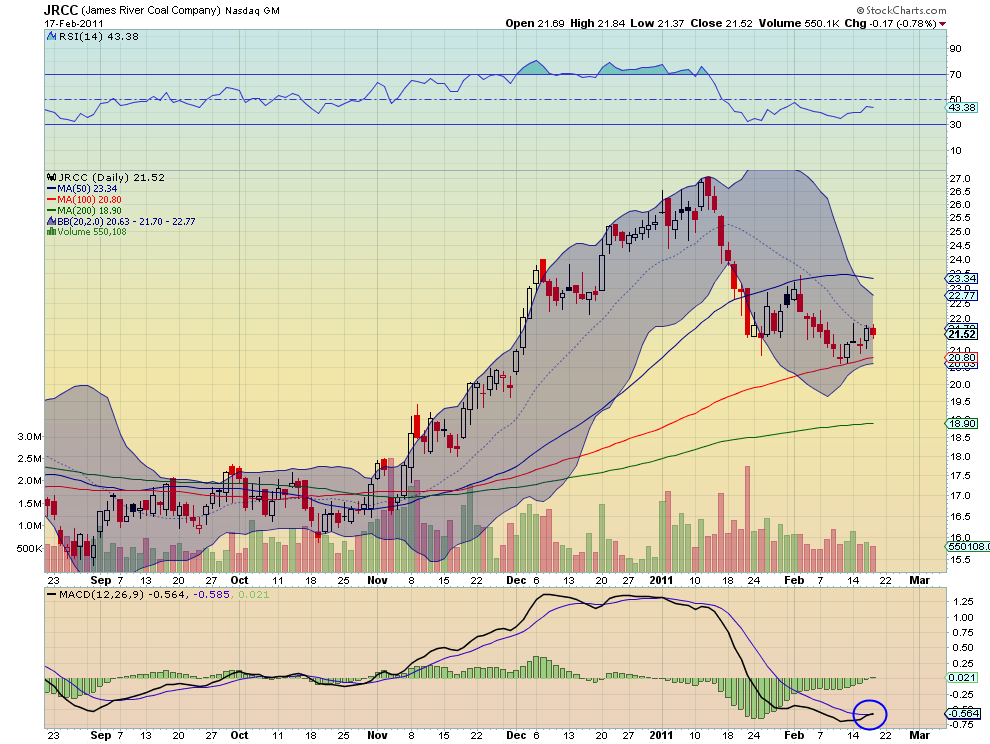
James River Coal, JRCC, has born the brunt of the downside but has recently found support at the 100 day Simple Moving Average (SMA). It is now rising slowly and and testing the mid point of the Bollinger bands. Through this mid point it will see resistance at the previous peak near 23 before being able to move higher. The MACD has turned positive and is crossing up bullishly, but the RSI is still in a bearish zone. Look for the RSI to pierce 50 and the the price above the Bollinger band midpoint before jumping into this name. But definitely keep it on your radar for the potential to retest the peak at 27.
Patriot Coal, Ticker: PCX
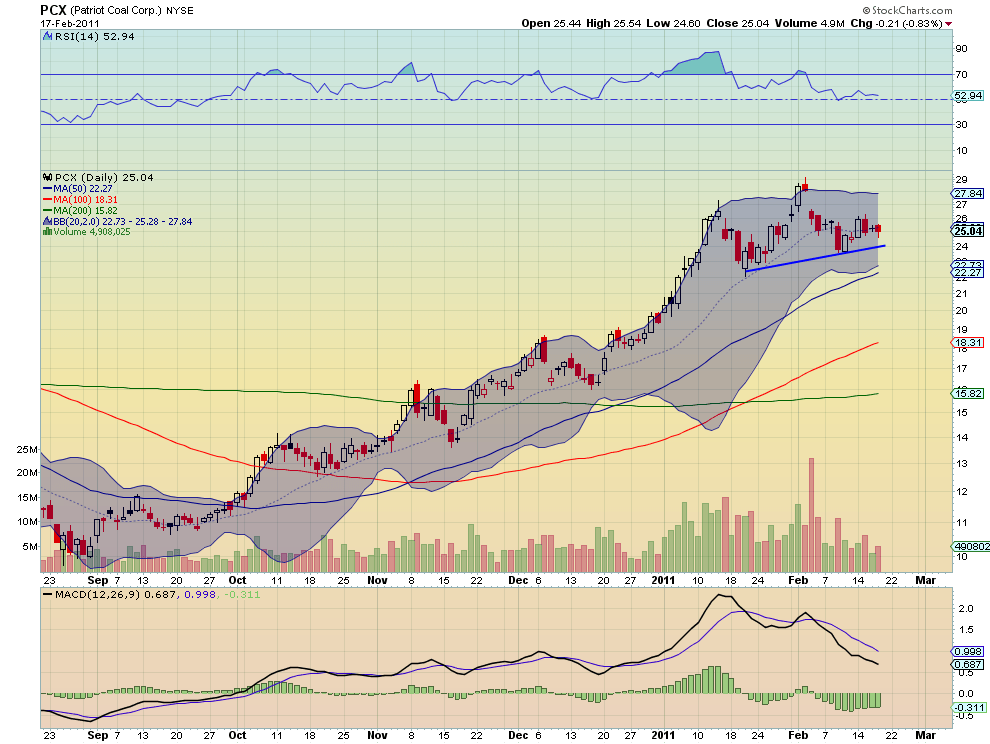
Patriot Coal, PCX, has fared much better, possibly because it has been the subject of takeover rumors. but the price action is what is important and it shows a continued rising trend, even in the short run. The RSI has been falling but has refused to move into the bearish zone so far. The MACD has stabilized but in negative territory. As long as it holds above the recent trend line in blue, it is still a bullish play but a better entry might be had at the trend line.
Walter Industries, Ticker: WLT
<
Walter Industries, WLT, is the best of the lot. It has the same descending triangle pattern as KOL, but it is breaking that pattern higher now, getting some lift from the 50 day SMA. The MACD is turning positive and crossing bullishly higher and the RSI is holding above 50 in bullish territory. It will see resistance at 132.15 and the 139.80 if it continues higher toward the target of the pattern break out at 148. Look for a hold of the break out to enter and then use that level as a stop loss.
As always you can see details of individual charts and more on my StockTwits feed and on chartly.)
If you like what you see above sign up for deeper analysis and trading strategy by using the Get Premium button above. As always you can see details of individual charts and more on my StockTwits page.
The information in this blog post represents my own opinions and does not contain a recommendation for any particular security or investment. I or my affiliates may hold positions or other interests in securities mentioned in the Blog, please see my Disclaimer page for my full disclaimer.
blog comments powered by Disqus
-
 Gregory W. Harmon CMT, CFA, has traded since 1986 and held senior positions including Head of Global Trading, Head of Product Development, Head of Strategy and Director of Equity. (More)
 -
Subscribe to Dragonfly Capital Views
Lifetime Subscription
$4,000.00Sign upAnnual Subscription
$1,000.00Sign upQuarterly Subscription
$350.00Sign up
Recent Posts
- Bull Scan for 10-13-26
- Premium Earnings 10-12-26: Citigroup and Johnson & Johnson
- 4 Trade Ideas Wells Fargo: Bonus Idea
- 5 Trade Ideas for Monday: AbbVie, Airbnb, Affirm, GE Aerospace and Walmart
- Top Trade Ideas for the Week of October 12, 2026: The Rest Premium
- Top Trade Ideas for the Week of October 12, 2026: The Best
- SPY Trends and Influencers October 10, 2026
- Macro Week in Review/Preview October 9, 2026
- Bull Scan for 10-12-26
- How this Week’s Premium Top 10 Performed, October 9, 2026
Archives