Swapping Black Gold for Shiny Gold
- Posted by Greg Harmon
- on February 16th, 2011
There has been a lot of talk about the spread differential between Brent Crude and West Texas Intermediate Crude (WTIC) lately with Brent flying while WTIC pulls back. I am not ready to throw in the towel on WTIC yet but I might swap some of the Black Gold for the real thing. Let me explain with the chart below.
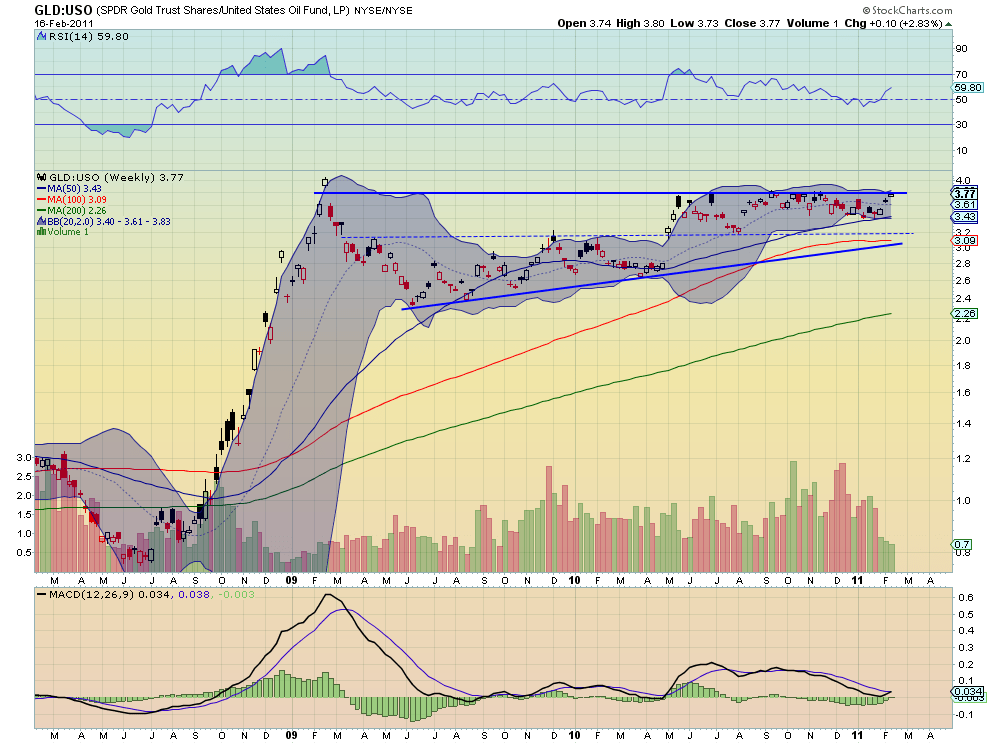
This is a weekly chart of the ratio of the SPDR Gold Trust Shares ETF, GLD, to the United States Oil Fund, USO, over the last 3 years. The two solid blue trend lines have been in control of this relationship for over two years, with the dotted line bifurcating the action between a test of the top or bottom. But there are some interesting features to the chart right now that suggest a break out may happen soon. First note the ratio is at the top of the range. It has been here before but this time looks to be different. Discounting the first move in early 2009, the next two touches in mid 2010 happened on solid black, bearish, candles. These are bearish because although the price closed higher the action with in the candle was negative, closing below the opening level. The Relative Strength Index (RSI) had hit the overbought condition on these moves as well and then retreated. The next string of touches of the top rail in September through November 2010 had their own issues, the biggest of which was a falling RSI through out the time period. This period also had a decreasing Moving Average Convergence Divergence (MACD) indicator.
So what is different this time? Everything. First the RSI has recently bounced off of the mid line and is heading higher with a good slope, but no where near the overbought indicator. Next the MACD is beginning to improve and has just bullishly crossed higher as the candle touches the top rail. Third the Bollinger bands have restricted suggesting a move soon, and are just hinting at an expansion. Additionally with the 50 week Simple Moving Average (SMA) acting roughly as the bottom of an ascending triangle since May, and it is squeezing into the apex.
The Trade
This can be played either of two ways. The first is by buying GLD and selling USO at a ratio of 4:1, for simplicity, when the chart breaks the top rail at 3.77. The expectation would be for a move of the ratio higher to 5 and to use the rail as a stop loss. The second way would be to buy GLD outright on a break, without the USO hedge. I prefer the first method as it reduces the capital put up, and both commodities are fairly volatile, so buying GLD would require a wider stop for the same trade.
As always you can see details of individual charts and more on my StockTwits feed and on chartly.)
If you like what you see above sign up for deeper analysis and trading strategy by using the Get Premium button above. As always you can see details of individual charts and more on my StockTwits page.
The information in this blog post represents my own opinions and does not contain a recommendation for any particular security or investment. I or my affiliates may hold positions or other interests in securities mentioned in the Blog, please see my Disclaimer page for my full disclaimer.
blog comments powered by Disqus
-
 Gregory W. Harmon CMT, CFA, has traded since 1986 and held senior positions including Head of Global Trading, Head of Product Development, Head of Strategy and Director of Equity. (More)
 -
Subscribe to Dragonfly Capital Views
Lifetime Subscription
$4,000.00Sign upAnnual Subscription
$1,000.00Sign upQuarterly Subscription
$350.00Sign up
Recent Posts
- Bull Scan for 10-13-26
- Premium Earnings 10-12-26: Citigroup and Johnson & Johnson
- 4 Trade Ideas Wells Fargo: Bonus Idea
- 5 Trade Ideas for Monday: AbbVie, Airbnb, Affirm, GE Aerospace and Walmart
- Top Trade Ideas for the Week of October 12, 2026: The Rest Premium
- Top Trade Ideas for the Week of October 12, 2026: The Best
- SPY Trends and Influencers October 10, 2026
- Macro Week in Review/Preview October 9, 2026
- Bull Scan for 10-12-26
- How this Week’s Premium Top 10 Performed, October 9, 2026
Archives