A Shooting Star Falling Back to Earth: Agrium
- Posted by Greg Harmon
- on February 15th, 2011
The fertilizer sector has been on fire since mid January, rocketing off into space. These stocks are all losing some steam now, but one, Agrium, turned into a Shooting Star and is now heading back to Earth. Yes literally a Shooting Star, at least as far as candlestick patterns are concerned. Let’s take a look.
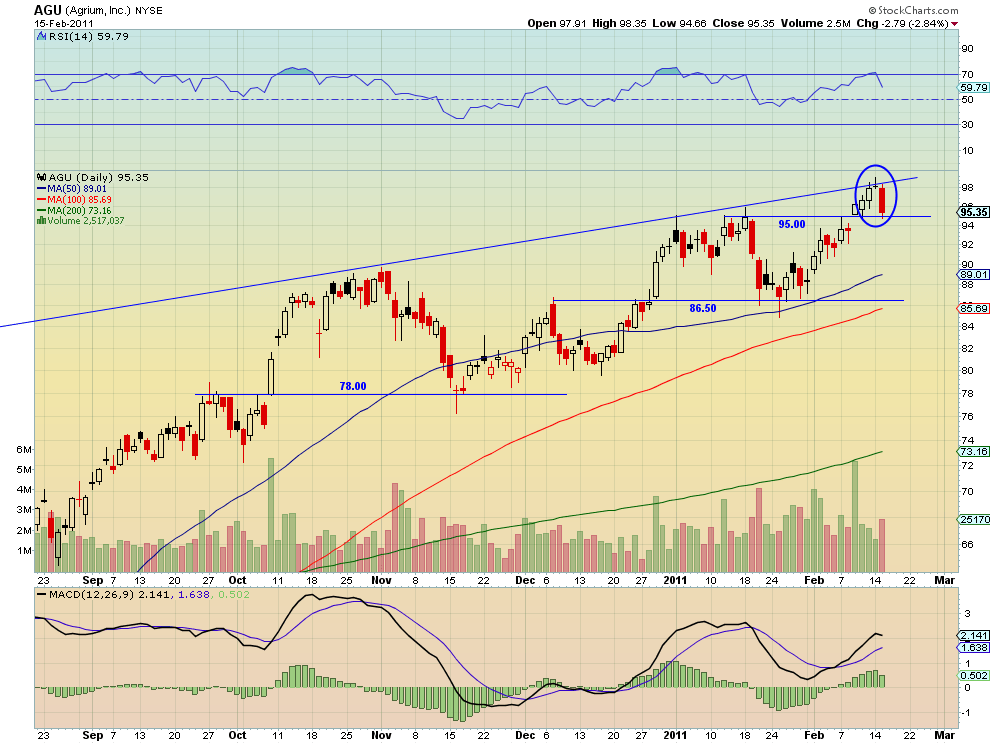
Above is the daily chart for Agrium, ticker AGU. You can see it reached the upward trend resistance line on Friday, potentially causing some technicians to be cautious. But focus on the candle printed on February 14. This is a Shooting Star. The upper shadow of the candle is is very long compared to the real body and there is a relatively small lower shadow. From this one candle you can tell that the the price opened higher than the previous day, traded much higher and then closed virtually unchanged. That implies bearish price action. Just looking at the trend you might think that it remains intact and continue to look for a break out higher. That is the value of the Shooting Star a quick identifier that there may be trouble.
Shooting Stars need to be confirmed and that happened and right at the open today, with a print below yesterday’s close and a move downward. There is an exception to the need for confirmation when the Shooting star has the same open, low and close, which is called a Gravestone Doji. Aren’t Japanese Candlesticks fun! At the start of the move down a savvy trader could have entered short today and pocketed a very nice 2.8% move. But what about tomorrow? Agrium closed today near support at 95, but switching back to Western Technical Analysis suggests there may be more downside. The Relative Strength Index (RSI) is pointing and sloping sharply lower which is bearish. The Moving Average Convergence Divergence (MACD) indicator is decreasing from a peak, also bearish leaning. If this stock gets through 95 then it is likely to continue lower to the 50 day Simple Moving Average (SMA) at 89.01, where it has found support previously, or the support/resistance level of 86.50 which will soon coincide with the 100 day SMA.
So you are forgiven if you did not recognize the Shooting Star, and jump on it immediately, but it still looks to have a bit of a ride until it burns out as it runs into the ground.
As always you can see details of individual charts and more on my StockTwits feed and on chartly.)
If you like what you see above sign up for deeper analysis and trading strategy by using the Get Premium button above. As always you can see details of individual charts and more on my StockTwits page.
The information in this blog post represents my own opinions and does not contain a recommendation for any particular security or investment. I or my affiliates may hold positions or other interests in securities mentioned in the Blog, please see my Disclaimer page for my full disclaimer.
blog comments powered by Disqus
-
 Gregory W. Harmon CMT, CFA, has traded since 1986 and held senior positions including Head of Global Trading, Head of Product Development, Head of Strategy and Director of Equity. (More)
 -
Subscribe to Dragonfly Capital Views
Lifetime Subscription
$4,000.00Sign upAnnual Subscription
$1,000.00Sign upQuarterly Subscription
$350.00Sign up
Recent Posts
- Bull Scan for 10-13-26
- Premium Earnings 10-12-26: Citigroup and Johnson & Johnson
- 4 Trade Ideas Wells Fargo: Bonus Idea
- 5 Trade Ideas for Monday: AbbVie, Airbnb, Affirm, GE Aerospace and Walmart
- Top Trade Ideas for the Week of October 12, 2026: The Rest Premium
- Top Trade Ideas for the Week of October 12, 2026: The Best
- SPY Trends and Influencers October 10, 2026
- Macro Week in Review/Preview October 9, 2026
- Bull Scan for 10-12-26
- How this Week’s Premium Top 10 Performed, October 9, 2026
Archives