Choosing the Best Way to be Green: A123 Systems or Natural Gas
- Posted by Greg Harmon
- on February 10th, 2011
Going Green on energy has been all the rage for some time. We all know this means cutting back on oil and using other fuels. But are there better green sources of energy than others? If you are a trader than the answer is yes. Let me explain. Below is the chart for A123 Systems (Ticker: AONE) the maker of rechargeable lithium-ion batteries.
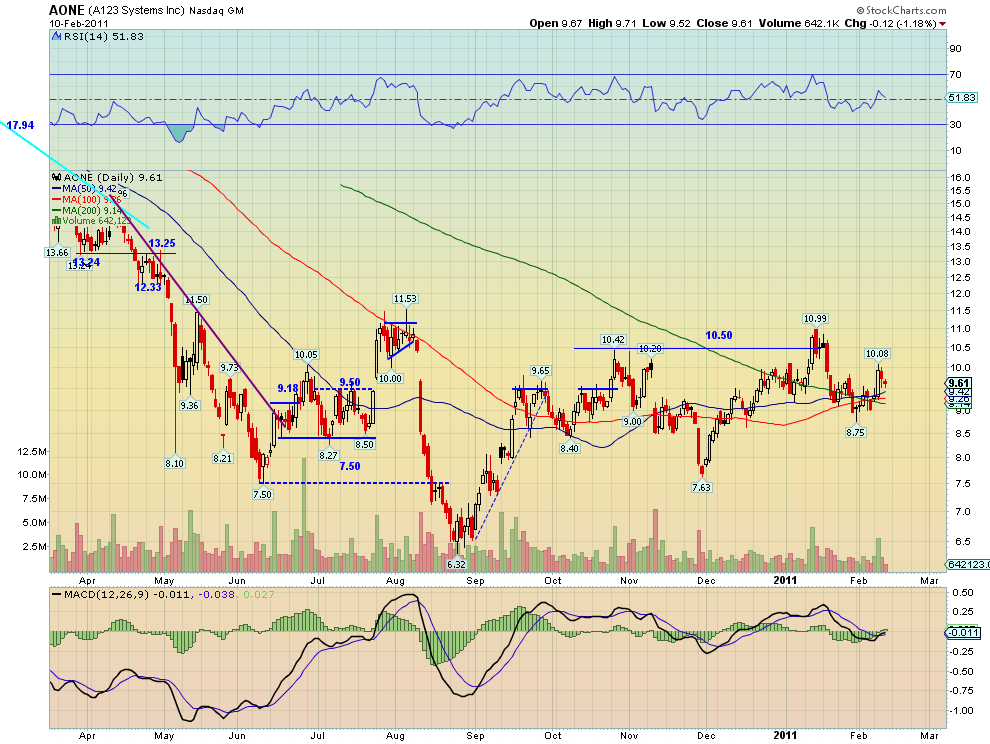
This stock has been moving back and forth in a sideways pattern since May. Other than the blip under the Simple Moving Averages (SMA’s) at the end of the year it has been in a tighter range between 8.50 and 10.5, with the 50 day and 100 day SMA’s acting as a springboard to the top of the range. These SMA’s are starting to lift and have crossed up through the 200 day SMA, the Golden Cross recently. The Relative Strength Index (RSI) has crossed back above the mid line into bullish territory, but is about to retest that line. The Moving Average Convergence Divergence (MACD) indicator is improving and trying to cross higher. Price has been in a two day pullback after hitting above 10 again but is very close to that SMA support. There are some bullish aspects to this chart but clearly some risks.
Now look at the chart for United States Natural Gas Fund (Ticker: UNG) below.

UNG has been stair stepping down for several months. Recently it tested and rejected at the longer downtrend line ad looks to be headed to a test of the previous low at 5.16 from October. The RSI is falling but not yet oversold and the MACD is growing more negative, both supporting a further move lower. Notice that the RSI breaching that oversold line has been an indicator of the bottom the last two moves though. There are bearish aspects to this chart but also some risks of reversal soon.
You can avoid some of these worries by looking at playing both stocks via a pairs trade. Below is the ratio chart for AONE against UNG.

Notice that this ratio has been in a downtrend as noted by the top line for more than a year. but also note that since September the downside to its range has been trending higher, creating a Symmetrical triangle. This technical pattern represents a market where neither the bulls or bears are in control as the range decreases. It is interesting for 3 reasons. First the pattern is longer than 3 months, which tends to make it more significant. Next, it is about 2/3 of the way through as the ratio is testing the top rail, which is the optimal place for a break out to hold. Finally, the anticipated move, equivalent to the distance between the rails or about 0.86, would set a target for a break out higher at 2.70. That would be a major move, and clearly there are other levels of resistance that it could incur along the way from previous highs. One more interesting aspect of this chart is that if it does not break out but rejects lower a move down at least to the SMA’s and potentially to the bottom rail would be anticipated.
Trade 1: Long 1 lot of AONE and short 1.8 lots of UNG on a break of 1.85, using the rail as a stop. For this trade you would move your stop higher as the ratio breaks above other previous highs.
Trade 2: Short 1 lot of AONE and long 1.8 lots of UNG should the ratio reject back to 1.8 using the top rail as a stop. For this trade look for a move to 1.59 at least.
Two ways to play these two stock and not worry about what each individual stock is doing. Sorry it is so complicated but as Kermit sang ‘It’s not easy being green’.
(As always you can see details of individual charts and more on my StockTwits feed and on chartly.)
If you like what you see above sign up for deeper analysis and trading strategy by using the Get Premium button above. As always you can see details of individual charts and more on my StockTwits page.
The information in this blog post represents my own opinions and does not contain a recommendation for any particular security or investment. I or my affiliates may hold positions or other interests in securities mentioned in the Blog, please see my Disclaimer page for my full disclaimer.
blog comments powered by Disqus
-
 Gregory W. Harmon CMT, CFA, has traded since 1986 and held senior positions including Head of Global Trading, Head of Product Development, Head of Strategy and Director of Equity. (More)
 -
Subscribe to Dragonfly Capital Views
Lifetime Subscription
$4,000.00Sign upAnnual Subscription
$1,000.00Sign upQuarterly Subscription
$350.00Sign up
Recent Posts
- Premium Earnings 10-13-26: Fastenal and Morgan Stanley
- Bull Scan for 10-13-26
- Premium Earnings 10-12-26: Citigroup and Johnson & Johnson
- 4 Trade Ideas Wells Fargo: Bonus Idea
- 5 Trade Ideas for Monday: AbbVie, Airbnb, Affirm, GE Aerospace and Walmart
- Top Trade Ideas for the Week of October 12, 2026: The Rest Premium
- Top Trade Ideas for the Week of October 12, 2026: The Best
- SPY Trends and Influencers October 10, 2026
- Macro Week in Review/Preview October 9, 2026
- Bull Scan for 10-12-26
Archives