Top Trade Ideas for January 24, 2011: The Rest
- Posted by Greg Harmon
- on January 23rd, 2011
After looking at over 700 charts, I have found some good setups for the week. Here are the second half of the top 10.
Dendreon, Ticker: DNDN
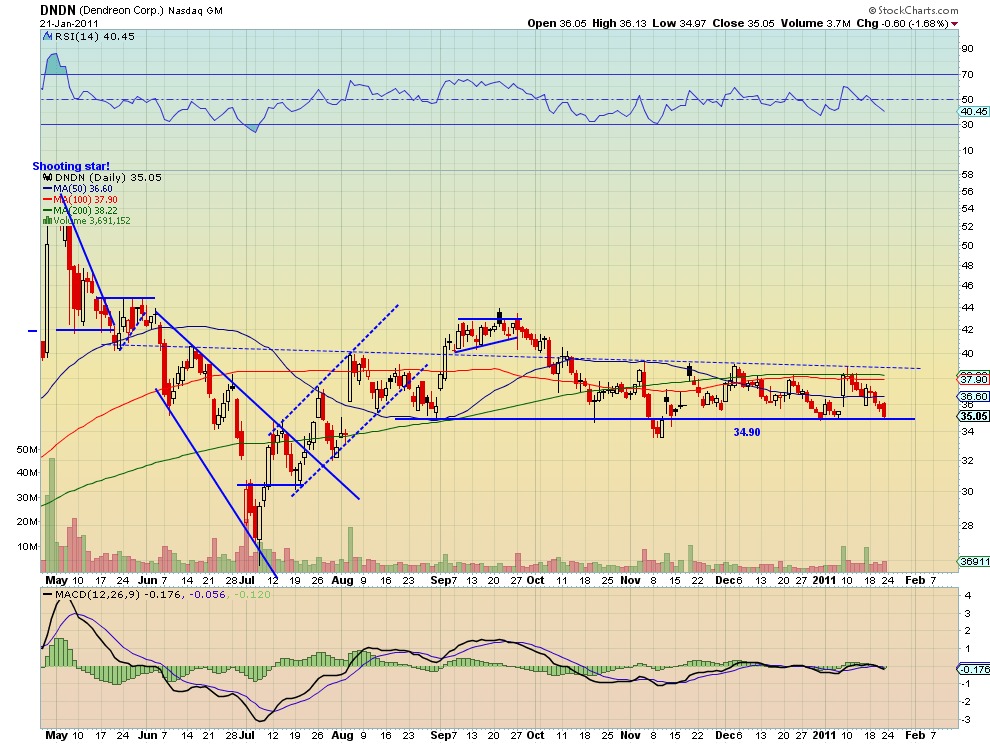
Dendreon has been in a sideways consolidation channel since the rally in the market began in September. It is now testing the bottom of that channel at 34.90 after a strong downward move Friday. The Relative Strength Index (RSI) is pointing lower, but not yet making new lows, with the Moving Average Convergence Divergence (MACD) indicator not giving much clue as to direction. Prepare for one of two plays. A hold at 34.90 can be played long to resistance at the Simple Moving Averages (SMA’s) starting at 36.60 and then the channel top at 39.70. If 34.90 fails as support then can be played short to support at 32and 30.25 below that.
Edwards Lifesciences, Ticker: EW
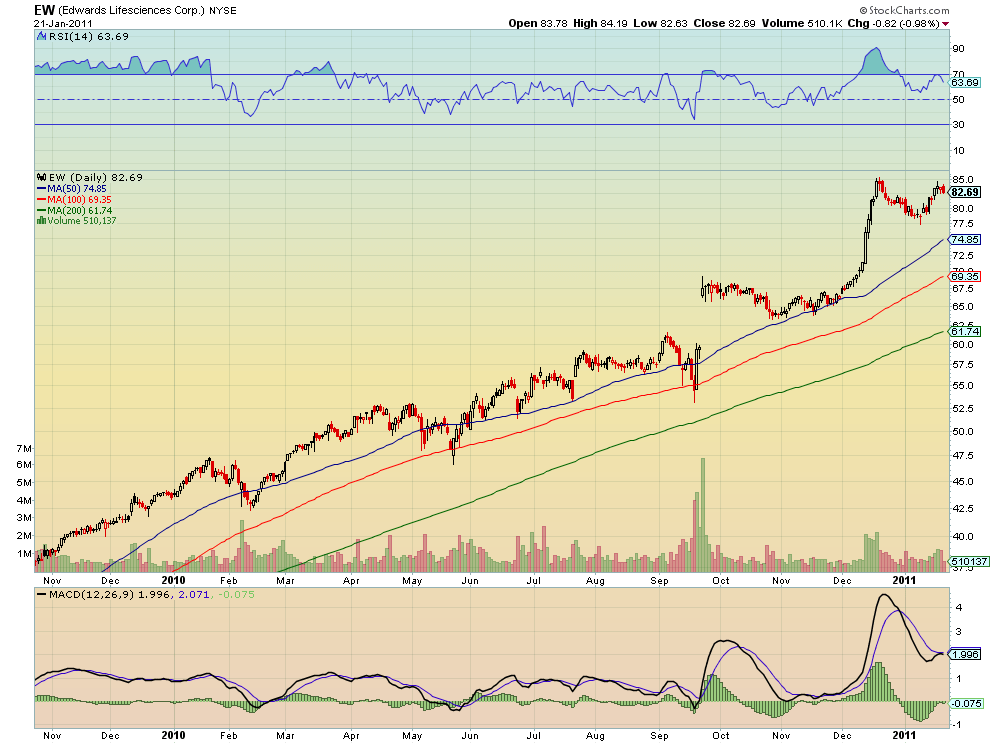
Edwards Lifesciences is testing the recent high of 85 achieved in December. That move came off of a solid base at 65. If it can get over 85 then it would have a target on a measured move (MM) at 98 off of the base at 78. The first resistance could be expected near 90. Note that the RSI is falling, having bounced off of the 70 overbought level, and the MACD is kissing and could turn either way. These suggest it wise to also prepare for a fall and if it gets under 81.0 there is support at 77.50 and then 75 below before a full retrace to 65.
JinkoSolar Holdings, Ticker: JKS
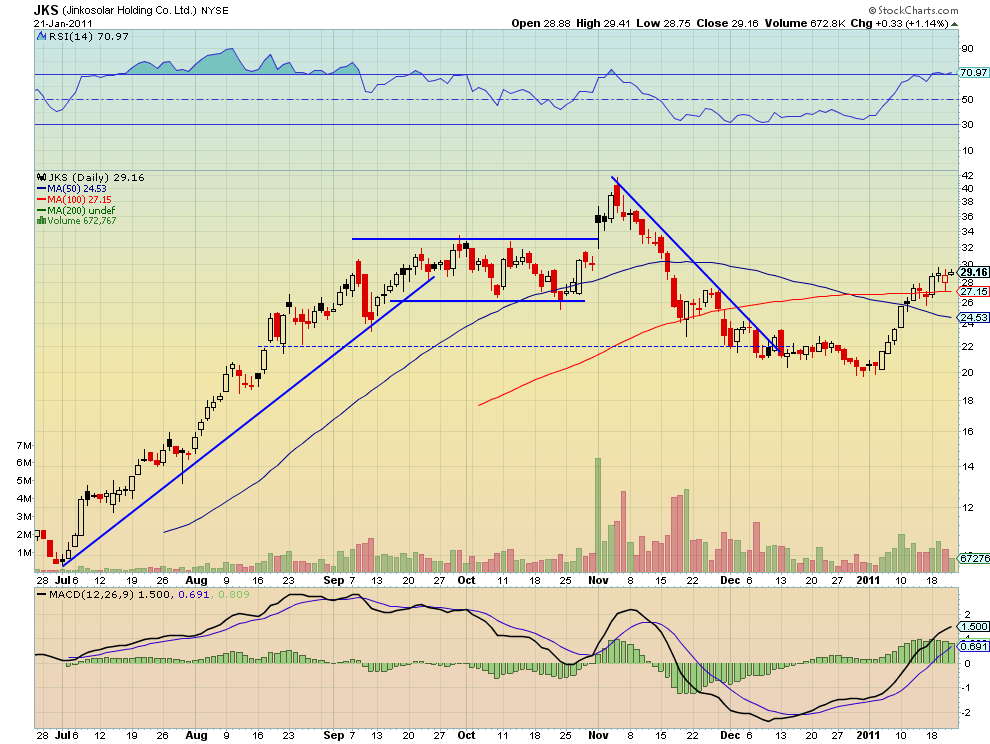
JinkoSolar is building a higher base while working off a slightly overbought RSI situation. Looking left along the chart shows that it has history in the 26 to 33 range. If it can break higher over 30 then expect resistance at 33 before an attempt higher at 36 and 40.50.
Magic Software Enterprises, Ticker: MGIC

Magic is bumping along the highs from December near 8.05. If it can get over 8.25 it has a target of 9.25 and then 11, from symmetrical moves to the move from 6 to 7.25 and then to its current level. A stop could be placed at 7.50.
Wabash National, Ticker: WNC
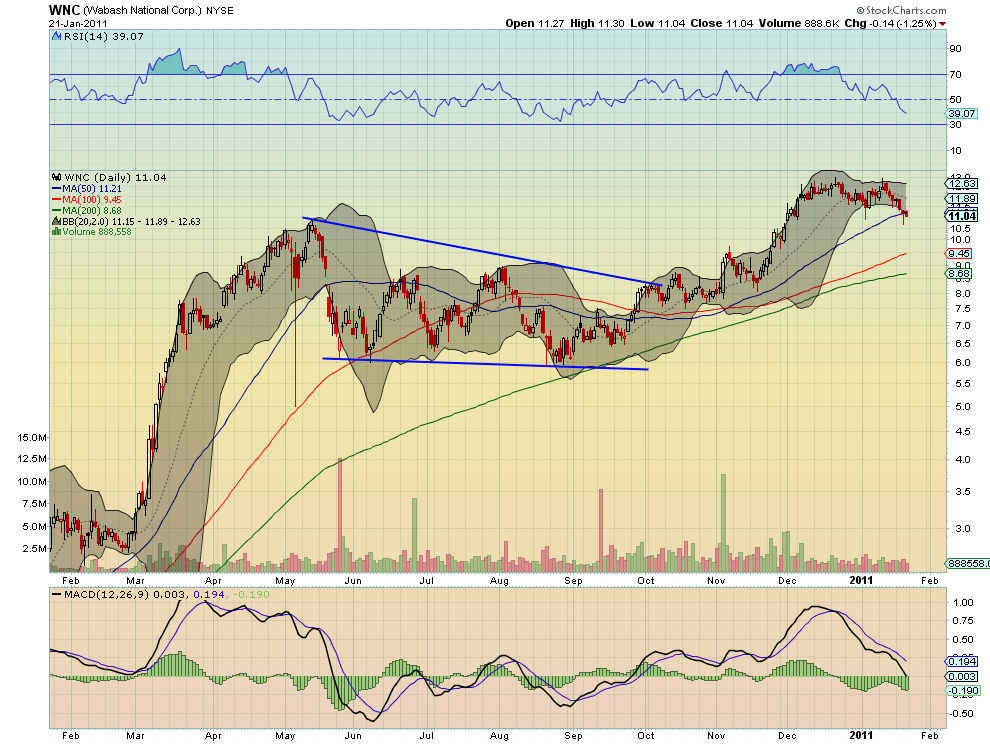
Wabash fell under the 50 day SMA Friday. The RSI is sloping and pointing lower and the MACD is growing more negative. There is some support lower at 10.50 from late November and then 9.50 below that. A stop could be placed at 11.40.
These were selected and should be viewed in the context of the broad Market Macro picture reviewed Friday which looks to continue the bloodbath for Gold, the US Dollar Index and US Treasuries. Although Crude Oil looks to be heading lower there is a lot of support nearby. The Shanghai Composite and Emerging markets look headed lower too. The divergence in the US equity Indexes, with the large cap SPY doing better than the QQQQ which is doing better than the IWM also looks to continue, with the SPY looking higher, the QQQQ mixed and the IWM looking lower. Sector Analysis showed that the strongest sectors are Consumer Staples and Utilities with Materials and Technology the weakest.
(As always you can see details of individual charts and more on my StockTwits feed and on chartly.)
If you like what you see above sign up for deeper analysis and trading strategy by using the Get Premium button above. As always you can see details of individual charts and more on my StockTwits page.
The information in this blog post represents my own opinions and does not contain a recommendation for any particular security or investment. I or my affiliates may hold positions or other interests in securities mentioned in the Blog, please see my Disclaimer page for my full disclaimer.
blog comments powered by Disqus
-
 Gregory W. Harmon CMT, CFA, has traded since 1986 and held senior positions including Head of Global Trading, Head of Product Development, Head of Strategy and Director of Equity. (More)
 -
Subscribe to Dragonfly Capital Views
Lifetime Subscription
$4,000.00Sign upAnnual Subscription
$1,000.00Sign upQuarterly Subscription
$350.00Sign up
Recent Posts
- Premium Earnings 10-13-26: Fastenal and Morgan Stanley
- Bull Scan for 10-13-26
- Premium Earnings 10-12-26: Citigroup and Johnson & Johnson
- 4 Trade Ideas Wells Fargo: Bonus Idea
- 5 Trade Ideas for Monday: AbbVie, Airbnb, Affirm, GE Aerospace and Walmart
- Top Trade Ideas for the Week of October 12, 2026: The Rest Premium
- Top Trade Ideas for the Week of October 12, 2026: The Best
- SPY Trends and Influencers October 10, 2026
- Macro Week in Review/Preview October 9, 2026
- Bull Scan for 10-12-26
Archives