Macro Week in Review/Preview January 14, 2011
- Posted by Greg Harmon
- on January 14th, 2011
Last week’s review of the macro market indicators looked like more pain for long holders of Gold and Treasuries, but brighter for the US Dollar index and Crude Oil. Emerging markets looked better higher with perhaps a slight pullback. Neither the Chinese market nor the Volatility Index looked to play a factor in influencing the US markets. SPY and QQQQ looked like the best of the US market Indexes, with strong bullish charts where as the IWM may need to pullback some before it could join them higher. But all Indexes looked higher longer term.
As the week started Crude Oil did pop but the US Dollar Index started falling fast. The initial reaction in Gold was slightly higher but that reversed and Gold was hammered lower later in the week. Treasuries basically moved sideways and equity indices slowly and steadily marched higher but finished with a bang Friday. What does this mean for new week ahead? Let’s look at the charts.
(As always you can see these individual charts and more on my twitter feed and on chartly.)
Gold Daily
Gold Weekly

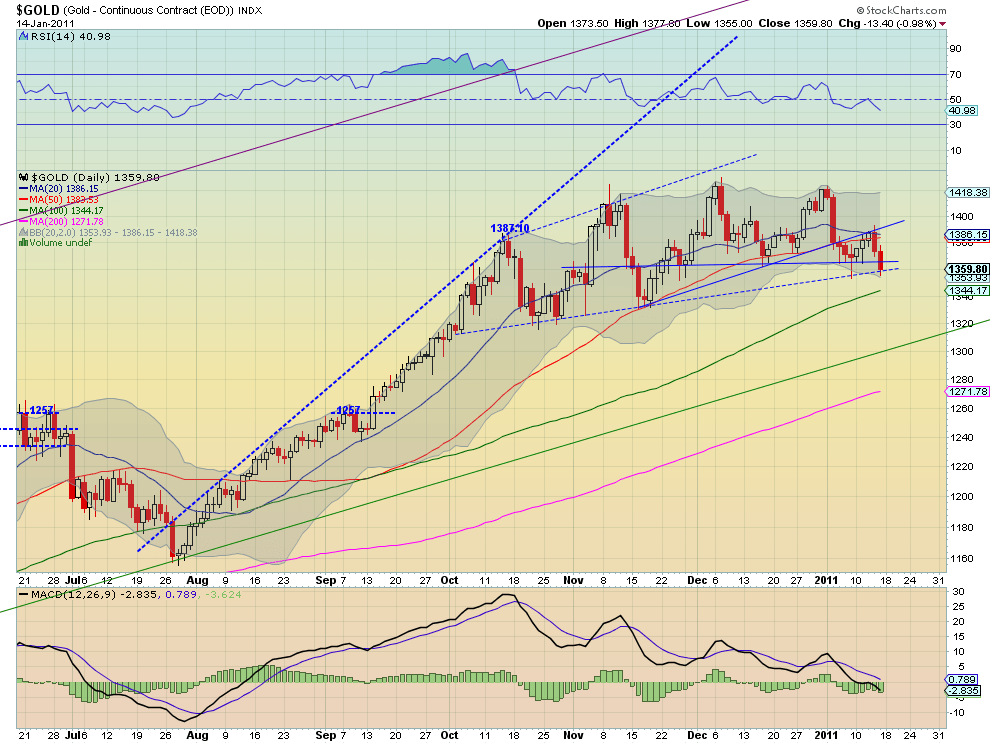
Gold had a rough week but did not lose support of the short term rising trendline at 1359. The falling 20 day Simple Moving Average (SMA)is acting as resistance and is about to cross the 50 SMA, a bearish signal. That said the solid green trend line near 1320 is the long term up trend so it still has some room to give before the uptrend can be declared over. The falling Relative Strength Index (RSI) and worsening Moving Average Convergence Divergence (MACD) indicator suggest the move lower will continue. The weekly chart is bit more cheery holding over the 20 week SMA with support at 1328 below that and the RSI still above 50. The bad news is that the MACD on the weekly chart has crossed lower. On a bounce Gold may encounter resistance at 1376 before it has some room to 1392 and 1410 from the daily chart.
West Texas Intermediate Crude Daily
West Texas Intermediate Crude Weekly
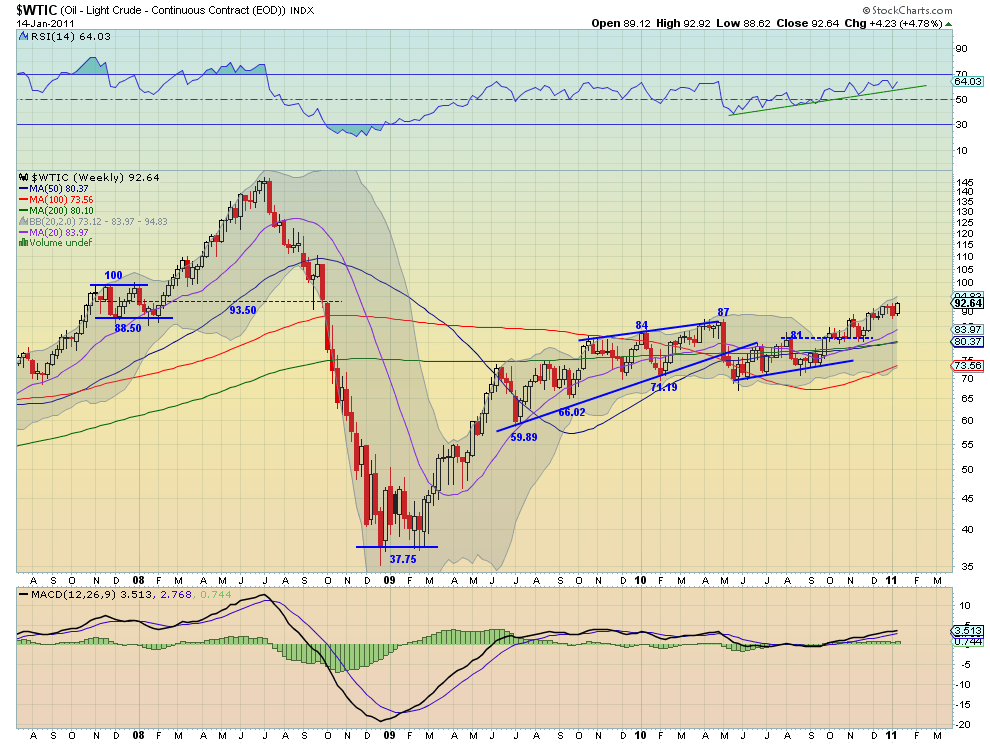
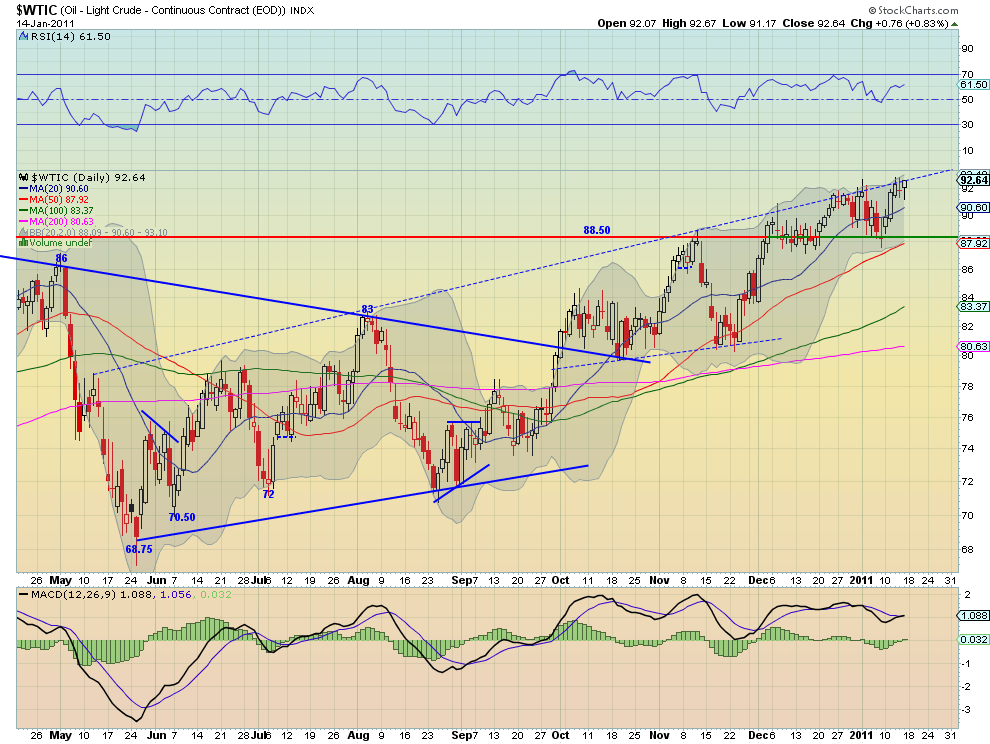
Crude Oil had a strong week bouncing off of support at the 88.50 area and rising to the uptrend resistance line at the end of the week. From here the RSI and MACD indicator on the daily chart suggest it can continue higher, and the next resistance would come at 95 and then 100. The rising SMA’s add to the rosy outlook. On the weekly chart there has been a clear rising trend on the RSI that looks to continue. The 93.50 area may offer some resistance before it can test 100.
US Dollar Index Daily
US Dollar Index Weekly
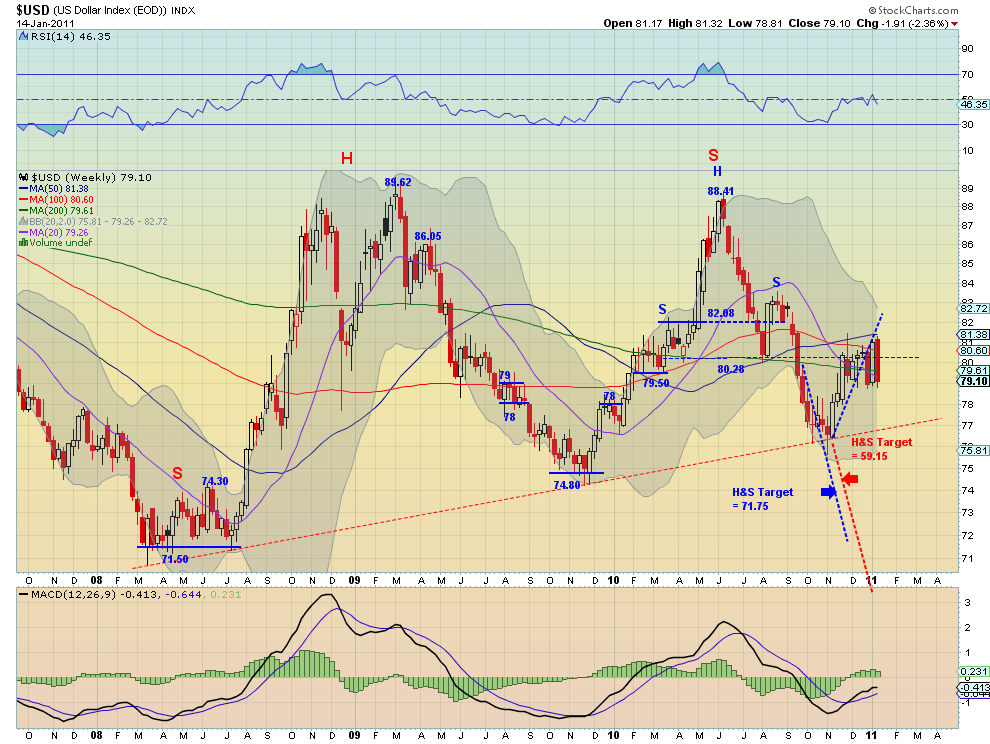
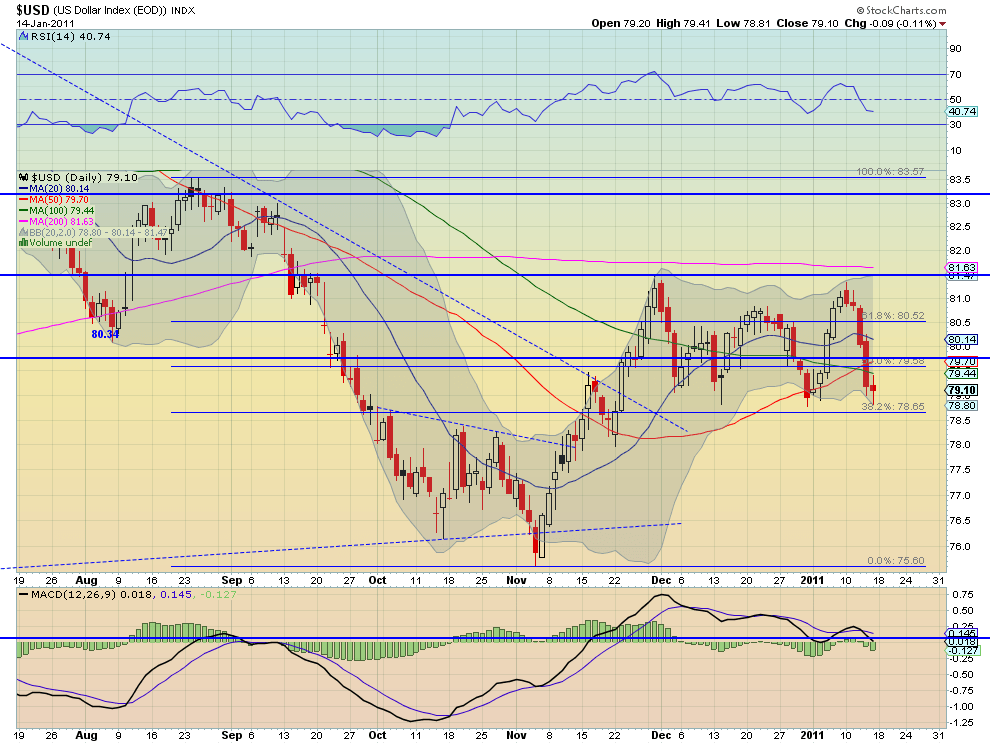
The US Dollar Index was taken to the woodshed this week after a strong week last week, reversing all of its gains. During the process it made a higher high. The small body candle Friday is a signal to watch for a reversal, as is the rolling of the RSI on the daily chart. The 50% retracement levels of 79.58 and 79.75 from the last large upward and downward moves continue to pull the index back from the edges of a range between 81.46 and 78.65. The weekly chart shows the oscillations of the last 3 weeks clearly with the range expanding slightly along the uptrend resistance line. There is support at 79 near where it is now and if that does not hold at 78 below and then the rising trendline at 76.80. I expect a bounce soon to rise back to the top of the range.
iShares Barclays 20+ Yr Treasury Bond Fund Daily
iShares Barclays 20+ Yr Treasury Bond Fund Weekly
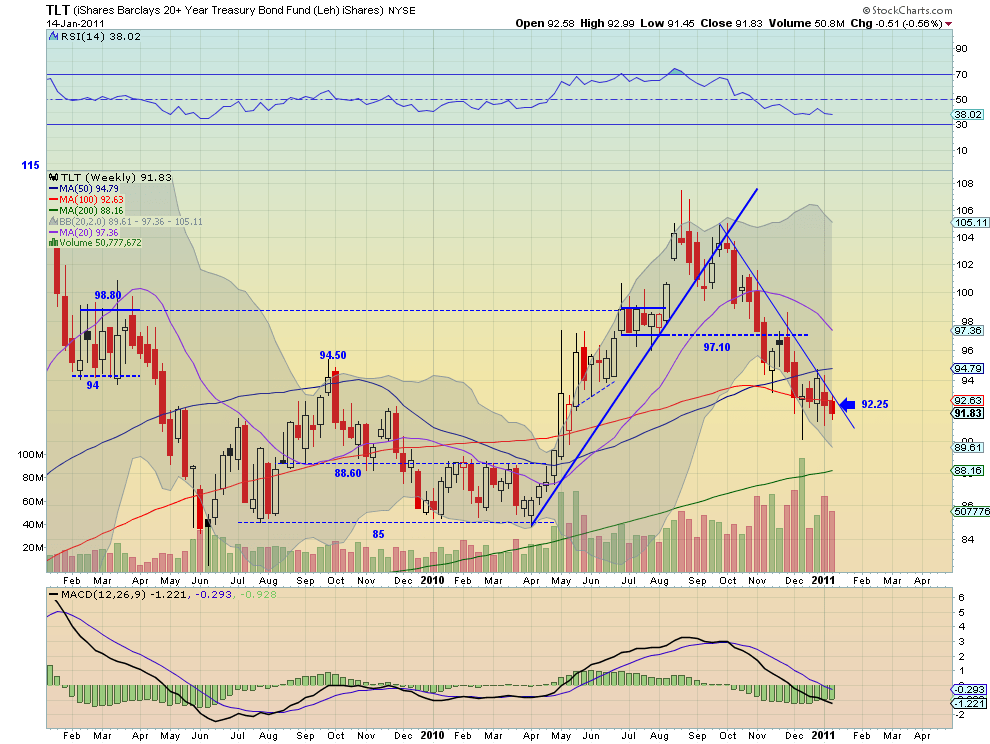
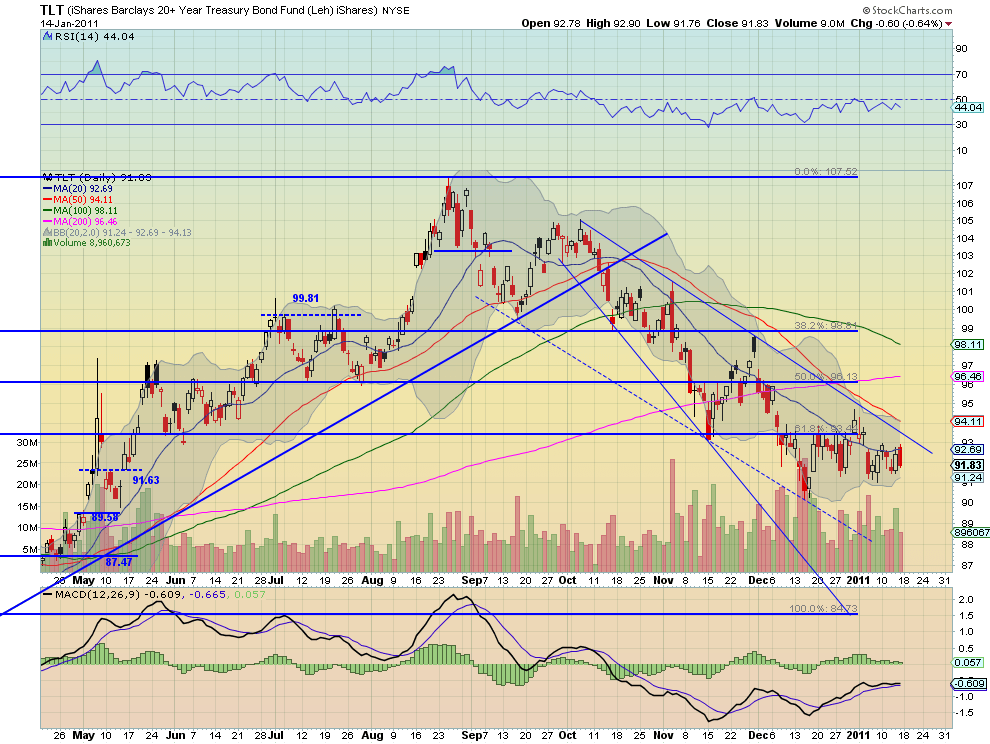
Treasuries put in a sideways week with a narrow range just underneath the 20 day SMA and the 61.8% retracement of the up move at 93.44 and just above the support area at 91.63. They are clearly still in a downward channel and can continue to consolidate until they reach the downtrend resistance at about 92.75, near the falling 50 day SMA. The RSI has continued to stall just below 50 and the MACD is now starting t curl lower on the daily chart suggesting more downside to come soon. The weekly chart shows the down trend resistance clearly but also that the price lost the support of the 100 week SMA this week. The RSI on the weekly is weak and the MACD is negative supporting a move lower. Support on the weekly chart shows up at 88.60 and then 85 below that. If it does break the trendline higher then there is resistance at 94 and 94.50 above the previous levels.
Shanghai Stock Exchange Composite Daily

Shanghai Stock Exchange Composite Weekly

The Chinese market got shook up by another reserve requirement hike. This drove the Index down near support at the 200 day SMA. There was a bearish cross of the 20 day and 100 day SMA. Also the RSI on the daily chart suggests that a test of the 200 day SMA support and then the channel at 2695 may be coming. The bottom rail of symmetrical triangle on the weekly chart at 2606 may also to come into play now as price has fallen below all the weekly SMA’s. This looks lower in the near term.
iShares MSCI Emerging Markets Index Daily

iShares MSCI Emerging Markets Index Weekly

Emerging markets measured by the ETF EEM have been a wide ranging consolidation phase since moving higher in September and October. The trend is still up as evidenced by the rising SMA’s and RSI continuing to bounce off of the mid-line. The area between 48 and 48.78 seems to represent some resistance as it has bounced there 3 times recently. Moving to the weekly chart , the consolidation above the break of the channel is more apparent. The tightening Bollinger bands suggest that the consolidation may end soon. If so the rising SMA’s and RSI on the weekly suggest a move up and there would be some resistance at 49.5 and then 52.50 from previous highs.
VIX Daily

VIX Weekly

The Volatility Index continued to make new lows this week closing on the lows of the last 3 years. All of the SMA’s point down and the RSI has been accelerating down suggesting more potential downside. On a spike there may be resistance at 18 and then 21.25 higher, areas where it has stalled before. The weekly chart shows that history has had lower levels and that the next support down is at 12.40 before a long stretch at 10. Expect this to meander lower with slight bumps up over the near term, paving the way for equities to go higher.
SPY Daily

SPY Weekly
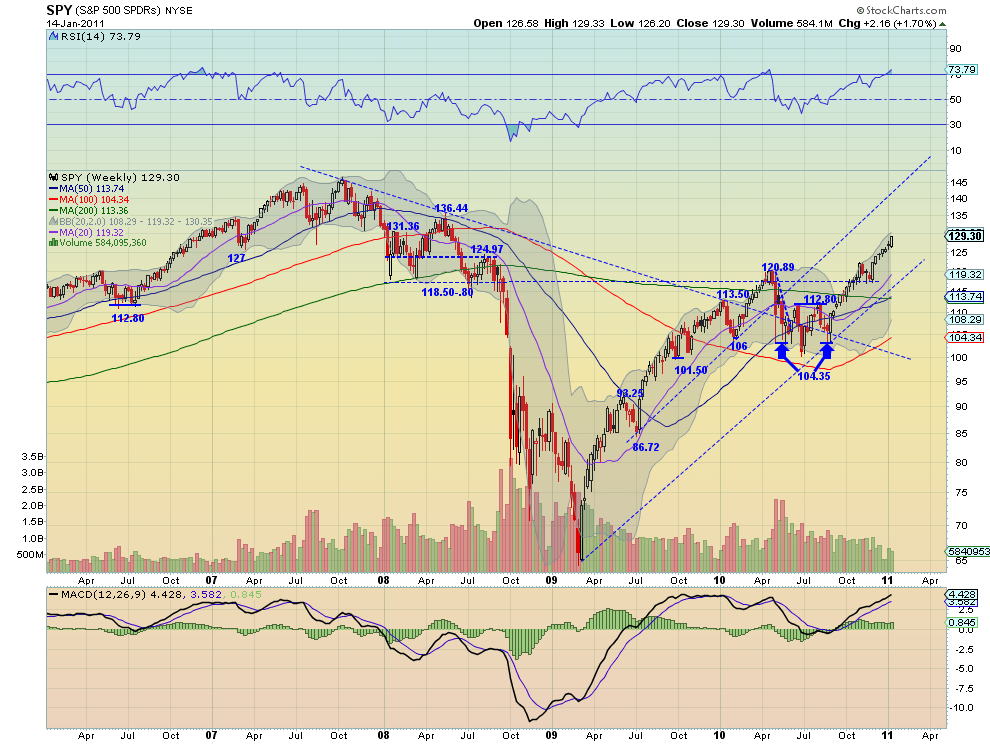
SPY ended the week with a bang making new highs. The trend, Bollinger bands and the SMA’s on the daily chart show no signs of that trend stopping. The RSI is getting a bit overbought but can remain that way for some time. The weekly chart shows the same bullish signs. A long trend higher in the middle of a rising channel with RSI just starting to break above 70. Of course it may pullback some time to the 20 day SMA or support at 127, but that would do nothing to break the uptrend. The next real resistance appears at the First Quarter 2008 highs at 131.36 and then 136.44.
IWM Daily
IWM Weekly

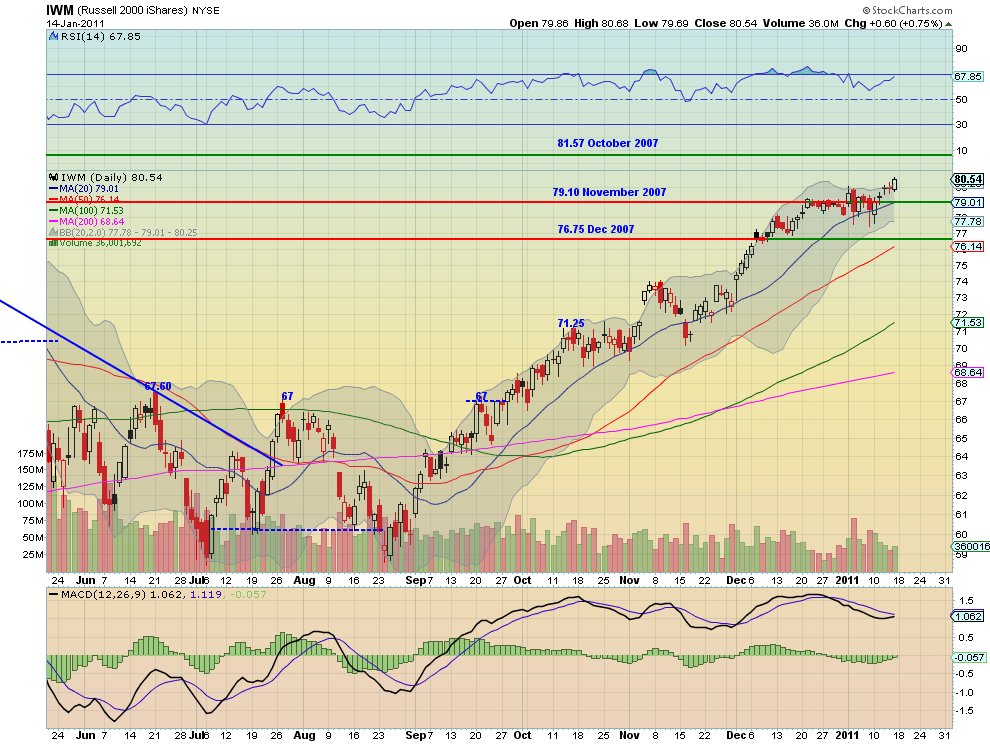
IWM broke out of a multi-week consolidation phase on the daily chart this week. It also has nice rising SMA’s and RSI but adds a bullish MACD cross on the daily chart. The weekly chart printed a very bullish candle this week as well. on this chart the RSI is also just starting to peak above 70. IWM has lots of room higher with the next resistance area coming near the October 2007 highs at 81.57-81.67. It also may pullback but has support very nearby at 79.10 from November 2007.
QQQQ Daily
QQQQ Weekly

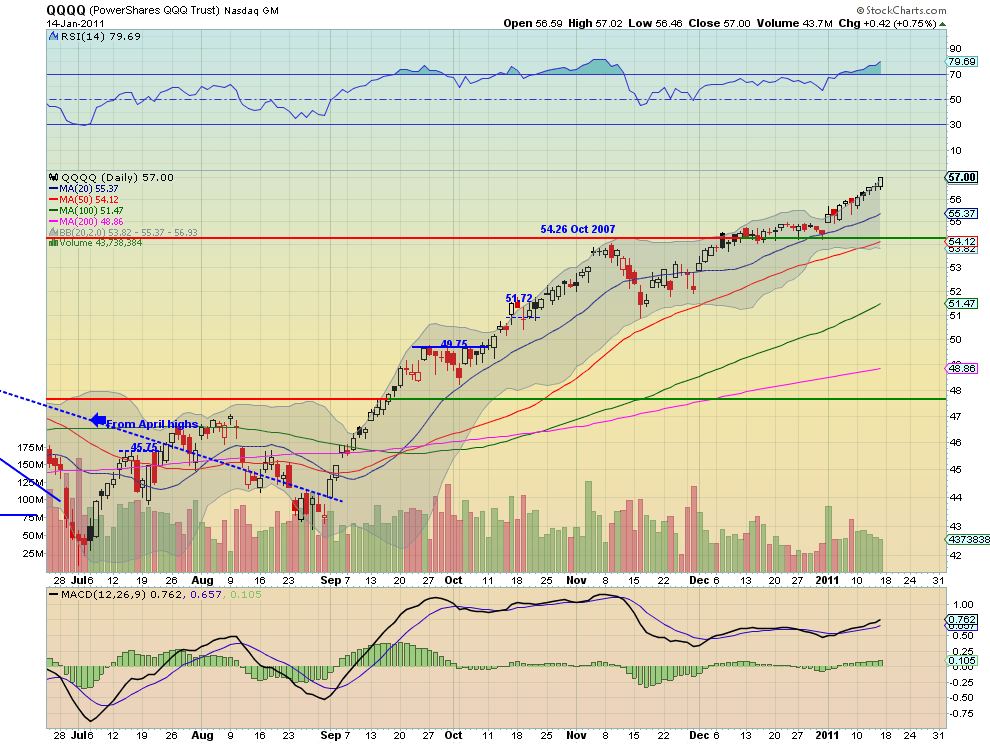
Rounding out the equity ETF’s the QQQQ also continued higher to new multi-year highs. the look back to the left on the chart to find the next resistance area near 60 is so far back, the end of 2000, that you have to wonder if anybody is still holding from then. A Fibonacci extension off the last down move gives a potential resistance area near 65.32. Both are a long way from the current 57. This daily chart also has nice rising SMA’s, RSI and MACD and has been riding the top of the Bollinger band, like a strong trend does. The weekly chart also shows all positive signs. The one signal to watch for in the future would be a potential MACD cross lower, but it looks unlikely now. The QQQQ’s do have a little more ground to give on a pullback with support at 55 and the 54.26 October 2007 high below that.
So next week looks to bring lower prices still for Gold but the bleeding could end soon with support nearby, and higher prices for Crude Oil. Treasuries look to resume their walk lower and the US Dollar Index looks to find support shortly and then move back higher. the Shanghai Composite looks to head lower but the other Emerging market are poised to move up. The low Volatility Index does not look to rise materially any time soon facilitating a further rise in the equity index ETF’s.
Use this information in your planning for next week and if you are interested in further interpretation send me a note. Enjoy the long weekend and trade’m well Tuesday.
If you like what you see above sign up for deeper analysis and trading strategy by using the Get Premium button above. As always you can see details of individual charts and more on my StockTwits page.
The information in this blog post represents my own opinions and does not contain a recommendation for any particular security or investment. I or my affiliates may hold positions or other interests in securities mentioned in the Blog, please see my Disclaimer page for my full disclaimer.
blog comments powered by Disqus
-
 Gregory W. Harmon CMT, CFA, has traded since 1986 and held senior positions including Head of Global Trading, Head of Product Development, Head of Strategy and Director of Equity. (More)
 -
Subscribe to Dragonfly Capital Views
Lifetime Subscription
$4,000.00Sign upAnnual Subscription
$1,000.00Sign upQuarterly Subscription
$350.00Sign up
Recent Posts
- Bull Scan for 10-14-26
- Premium Earnings 10-13-26: Fastenal and Morgan Stanley
- Bull Scan for 10-13-26
- Premium Earnings 10-12-26: Citigroup and Johnson & Johnson
- 4 Trade Ideas Wells Fargo: Bonus Idea
- 5 Trade Ideas for Monday: AbbVie, Airbnb, Affirm, GE Aerospace and Walmart
- Top Trade Ideas for the Week of October 12, 2026: The Rest Premium
- Top Trade Ideas for the Week of October 12, 2026: The Best
- SPY Trends and Influencers October 10, 2026
- Macro Week in Review/Preview October 9, 2026
Archives