A Stock That Can Please Everyone! – AAPL in Three Timeframes
- Posted by Greg Harmon
- on September 29th, 2010
There has been a strong focus on Apple (ticker AAPL) since it’s straight line run from 235 to over 290 in about a month. Bears are drooling to short it back down to 250 and bulls see the pause after recent channel break as an opportunity to buy cheap stock. As a market leading stock a majority from both sides sees whatever direction that Apple takes as the next direction of the market. I think there is a possibility that everyone, bulls and bears alike, may find happiness in this stock.
Look at the daily chart for Apple.
AAPL Daily

Breaking above the 279 high and continuing to new highs was a bullish event. Often times when a break like that occurs the stock will retrace back to support, often at the the breakout level, and either continue lower (a failed break out) or test the level and bounce to new highs. It happens a lot, is healthy, and many traders wait for that retest as confirmation before playing. The Apple daily chart shows that it has been working off an overbought Relative Strength Index (RSI) from above 70 and has had a waning Moving Average Convergence Divergence (MACD) indicator the last few days. These momentum indicators signaled a potential for a pullback and this is what is happening. Where will it end? I see support at 282.50 and then the past high of 279.01 as possibilities.
Switching to the weekly chart, indicates that the bulls SHOULD be happier if Apple pulls back a little going into the weekend.
AAPL Weekly

Although it is only Wednesday on this print, if the weekly chart did not go any lower, then Apple would print a bearish Hanging Man candle. But if Apple were to pullback and close lower the Hanging Man would either not exist or become a weaker signal until 284.69. At that point it would start to create a bearish Dark Cloud Cover pattern. Both patterns would need to be confirmed next week, and could be overcome. But I think that bulls would be happy to give up a couple of dollars here for a brighter prospect moving forward. But the bulls ability to give back some ground to their bearish friends and still be happy gets even better when looking at the monthly chart.
AAPL Monthly, 19 Years
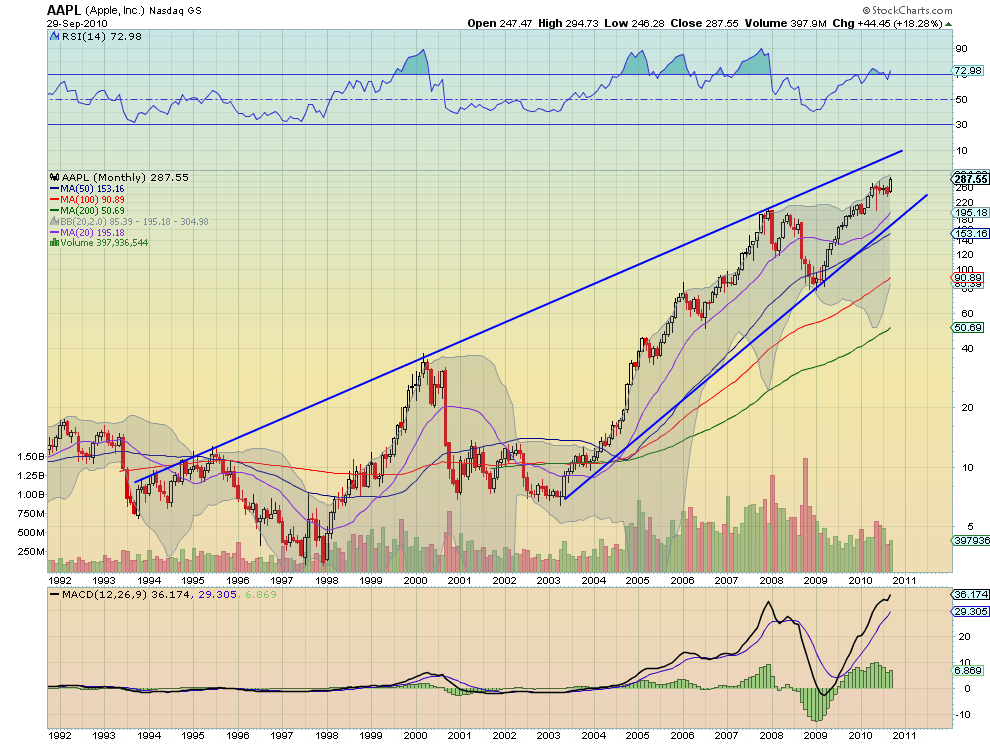
Apple is clearly in a very long term bullish rising wedge from this 19 year chart. Focus in on the last 3 years though.
AAPL Monthly, 3 Years
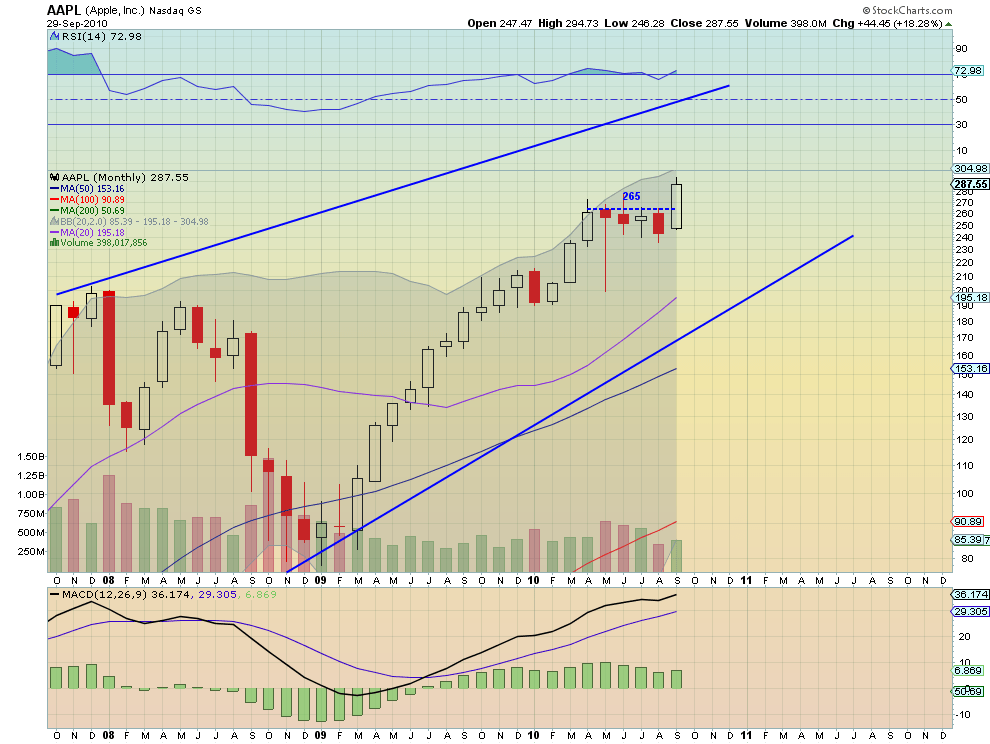
This chart shows that barring a melt down tomorrow, the last day of the month, the chart will print a breakout of the recent 5 month flag following a bullish Advancing Three White Soldiers pattern. The breaking point for the bulls would be below 265 where the monthly chart would raise a flag about a possible change in trend. That is over $22 or more than 7.5% from where it closed today. It could happen, but it would take a lot.
So you see that in the current pullback we can find peace between the bulls and the bears in this market leader.
If you like what you see above sign up for deeper analysis and trading strategy by using the Get Premium button above. As always you can see details of individual charts and more on my StockTwits page.
The information in this blog post represents my own opinions and does not contain a recommendation for any particular security or investment. I or my affiliates may hold positions or other interests in securities mentioned in the Blog, please see my Disclaimer page for my full disclaimer.
blog comments powered by Disqus
-
 Gregory W. Harmon CMT, CFA, has traded since 1986 and held senior positions including Head of Global Trading, Head of Product Development, Head of Strategy and Director of Equity. (More)
 -
Subscribe to Dragonfly Capital Views
Lifetime Subscription
$4,000.00Sign upAnnual Subscription
$1,000.00Sign upQuarterly Subscription
$350.00Sign up
Recent Posts
- Bull Scan for 10-14-26
- Premium Earnings 10-13-26: Fastenal and Morgan Stanley
- Bull Scan for 10-13-26
- Premium Earnings 10-12-26: Citigroup and Johnson & Johnson
- 4 Trade Ideas Wells Fargo: Bonus Idea
- 5 Trade Ideas for Monday: AbbVie, Airbnb, Affirm, GE Aerospace and Walmart
- Top Trade Ideas for the Week of October 12, 2026: The Rest Premium
- Top Trade Ideas for the Week of October 12, 2026: The Best
- SPY Trends and Influencers October 10, 2026
- Macro Week in Review/Preview October 9, 2026
Archives