From the Charts: Macro Month in Review/Preview September 30, 2010
- Posted by Greg Harmon
- on September 30th, 2010
Saturday night I reviewed the macro market indicators for the week. It looked then to bring stronger prices for Gold again and more flogging of the US Dollar Index. US Treasury Bonds have been changing direction with changes in sentiment and Oil looked to be stagnating. The relatively low and stable volatility index combined with that weaker dollar seemed to be creating a fertile environment for stocks to continue higher. Treasuries and Oil started the week heading higher and lower respectively, while Gold, the US Dollar Index and equities behaved as expected. Then came September Quarter end. Oil which started to move yesterday rocketed higher, the S&P 500 blasted through 1150 for about a nanosecond before settling into the recent range again with Treasuries doing the inverted opposite. An exciting day.
But there has been so much focus on this daily detail lately it is time to step back a bit and see what impact this action is having on the monthly picture. Tonight being the end of September we get to add another data point and broader perspective to the insights of the monthly charts. Let’s take a look.
Gold Monthly
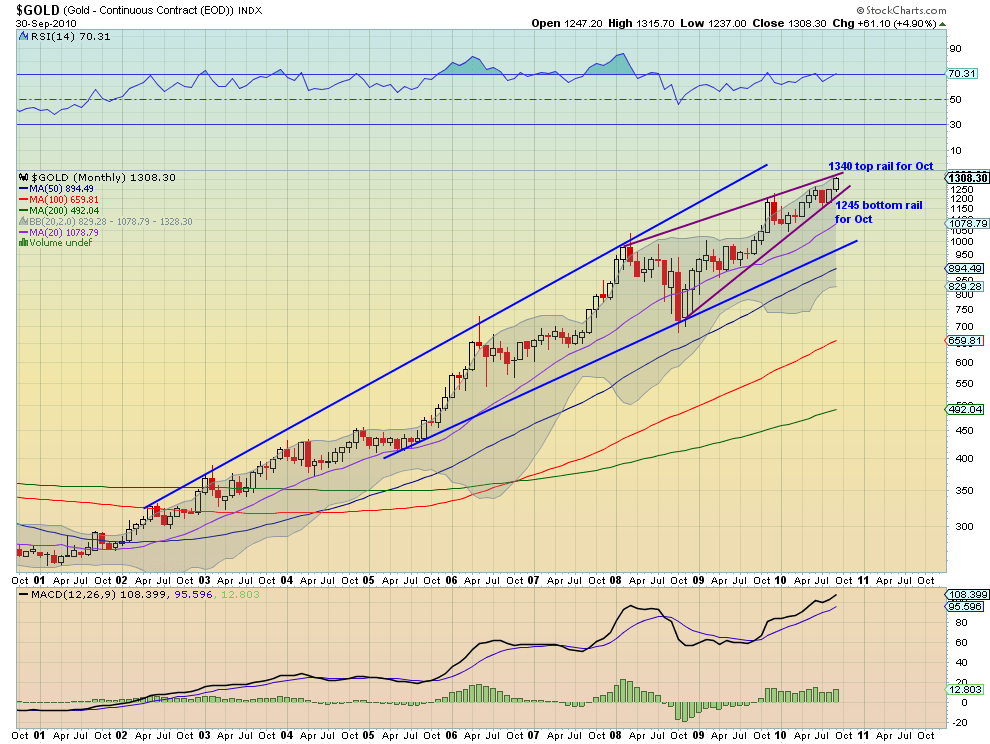
Gold has been on a meteoric rise for nearly ten years. The rising broadening channel shows this clearly on the monthly charts. Within that channel there has been a tightening wedge for the last 3 years which looks to be resolving soon. This wedge can be either bullish or bearish but is biased to being bullish given that the Relative Strength Index (RSI) and the Moving Average Convergence Divergence (MACD) indicator are both also rising during this time. There is currently resistance from the top rail of this shorter wedge at 1340 and support at 1245. Support also exists within the larger wedge at the 20 month Simple Moving Average (SMA) at 1078.79. The RSI signals that Gold is minimally overbought but will not prevent a further rise. Gold has more room to the upside.
West Texas Intermediate Crude Monthly

Oil has been building a base or flag on the 67.70 price level since its rise there from the lows of December 2008 into January 2009. This month’s candle, a Marubozu, is very bullish however, indicating that buyers were in control for the entire month. This often bodes for higher prices in the future. There is resistance in the chart at 80, near where it is now, and at 87-88.50 above. With the 20 month SMA rising towards the 50 month SMA look for a test of higher levels. Support comes from that 20 month SMA and the 67.70 base. The MACD and RSI are pretty much in neutral to slight positive but do not give add a strong bias. The Bollinger Bands are tightening quickly though and could create a move soon.
US Dollar Index Monthly
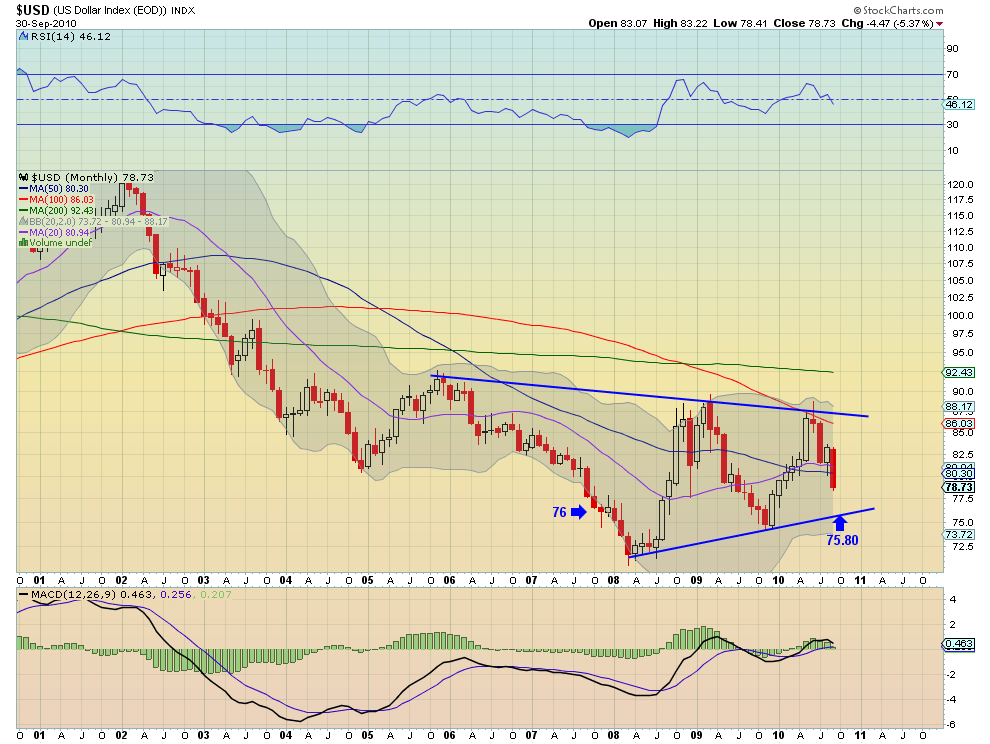
The US Dollar Index has fallen through the 80 area which has been support 4 times in the last 20 years (as far as my charts go back). This is also where the 20 and 50 month SMA’s reside. This is serious. The strong move downward shown in the long red candle this month, bodes for more downside. There appears to be some support at 78 (note the Doji in August 2009) and then 76 and the wedge bottom near 75.80. The falling RSI and declining MACD indicator reinforce the downside case.
iShares Barclays 20+ Year Treasury Bond Fund, TLT Monthly

US Treasuries as proxied by the iShares Barclays 20+ Year Treasury Bond Fund, ticker TLT, are in an up trend. Bond prices are rising meaning yields are trending lower. This chart has been the most confusing recently of the macro indicators, and this month does not add a lot of clarity. The move higher last month was mostly retraced this month, but with a Hanging Man candle, which is a potential bearish indicator, but did not violate the upward trend line. There is support at 100-101. This month is also an inside or consolidating print. Looking from a more purist Western Technical Analysis perspective though the price, volume, MACD indicator and RSI are all rising. Resistance can be found at 109 and then 112.50. Look for higher prices still to come.
VIX Monthly

The Volatility Index or VIX based out of the long downward channel 5 months ago and has been consolidating in to a narrower range. There is support of the 100 and 200 month SMA’s between 21.26 and 21.64. If this fails then there is support at the 16 level. The RSI is neutral in this discussion and the MACD is also low. The VIX could stay in a range for a while as the SMA’s previously discussed and the 50 month SMA, as resistance above near 25.11, are all trending flat with the declining 20 month SMA at 28 not looking to contact them for a few months.
SPY Monthly

The SPY continued its move higher this month from the June pullback, rising off of the 100 month SMA near 106.76 to close with a test of the 50 month SMA at 115.29. The 20 month SMA is turning higher and looks to add support to the rise going forward. Both the MACD and the RSI are also starting to increase, adding to the bull case. There is resistance higher at the 116.93 Fibonacci retracement level (61.8% of move from the 2002 lows to the 2008 highs) and then near 121 the previous high area from April. A test of 116.93 seems likely.
IWM Monthly
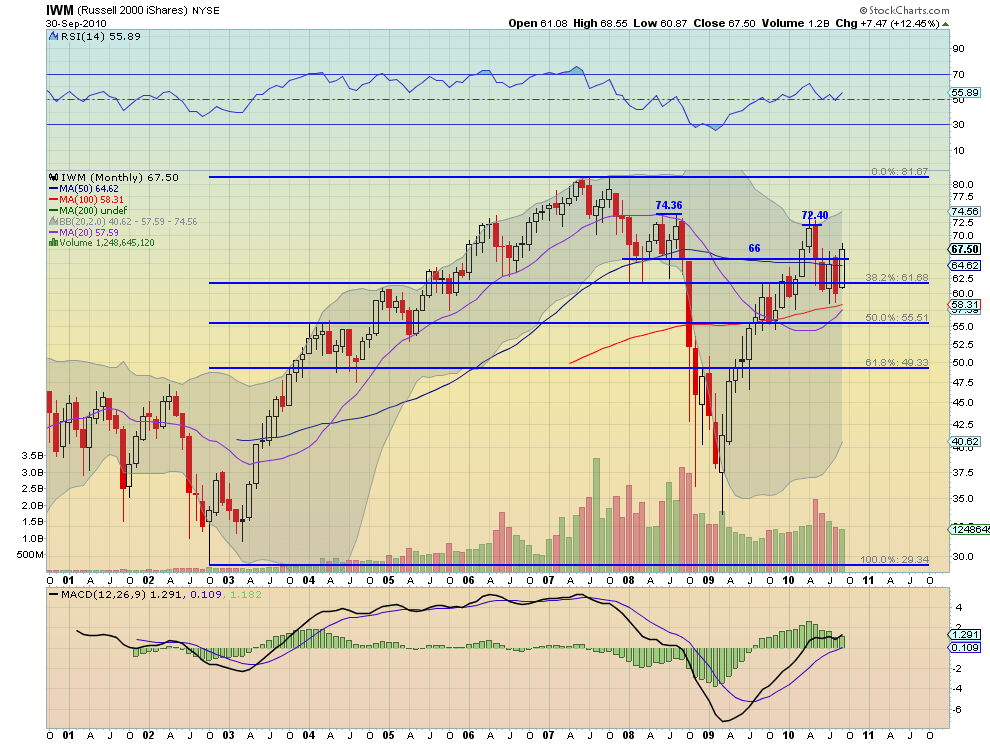
IWM, the Russell 2000 ETF, had a strong monthly move upwards, finishing through the 66 area that has been support in the past. There is resistance above at 72.40 and then 74.34 before challenging the 2007 highs at 81. The MACD and RSI are also starting to rise, and the 20 month SMA is about to cross higher through the 100month SMA adding upside support. Further support can be seen from the strong 4 month hold near the 38.2% Fibonacci retracement level, 61.68, before this month’s rise through resistance. A break of 67.50,signals a test of resistance higher and looks likely.
QQQQ Monthly
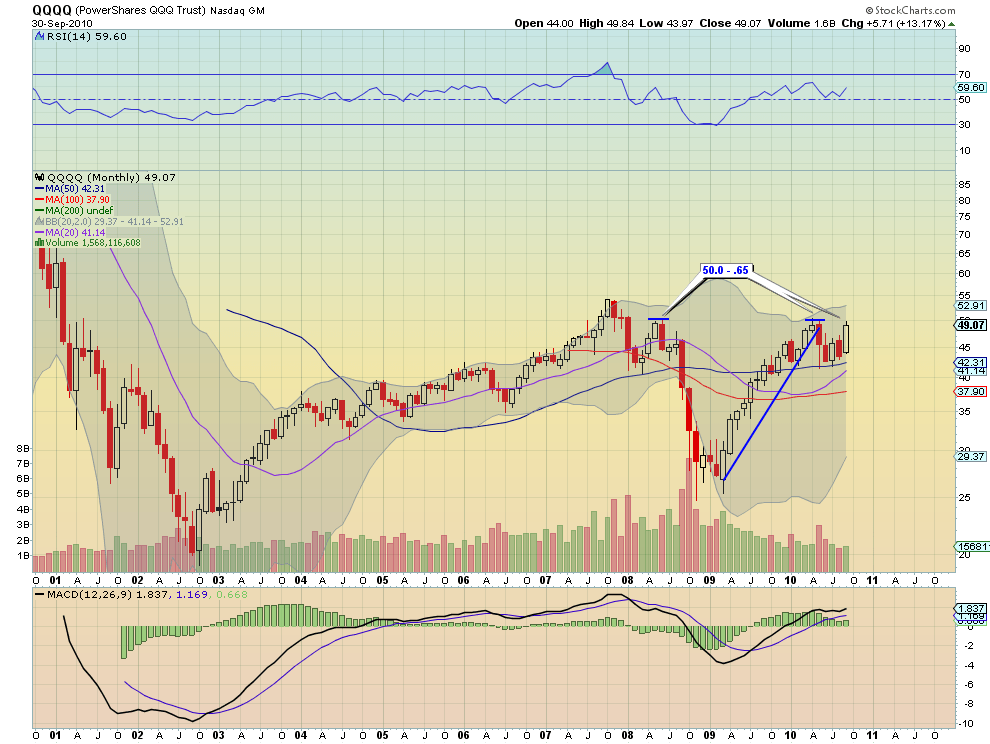
The Nasdaq 100 ETF, QQQQ, also had a strong monthly move upward out of its consolidation range to test the highs from mid-2008 and April and May this year. This continues the trend higher. Is it a triple top? The rising MACD and RSI indicate that it may have more in the tank. Also the 20 month SMA is moving higher and about to cross above the 50 month SMA, which is also starting to turn up,adding rising support. If it gets through the 50 area then 54.26 from 2007 is the next resistance. the bias is to the upside.
Gold appears to continue its move higher and potentially start a steeper climb. Oil is joining it now after moving strongly off of its base. The US Dollar index appears very sick and could potentially test generational lows. US Treasury prices seem poised to move higher, further reducing yields, although they may wander on the way up. The Volatility Index is likely to not be a factor for at least a couple of months until the shorter SMA starts to play a role. All of this leads to an environment where the Equity ETF’s SPY, IWM and QQQQ are set up to move higher from the monthly charts.
Trade’m well!
If you like what you see above sign up for deeper analysis and trading strategy by using the Get Premium button above. As always you can see details of individual charts and more on my StockTwits page.
The information in this blog post represents my own opinions and does not contain a recommendation for any particular security or investment. I or my affiliates may hold positions or other interests in securities mentioned in the Blog, please see my Disclaimer page for my full disclaimer.
blog comments powered by Disqus
-
 Gregory W. Harmon CMT, CFA, has traded since 1986 and held senior positions including Head of Global Trading, Head of Product Development, Head of Strategy and Director of Equity. (More)
 -
Subscribe to Dragonfly Capital Views
Lifetime Subscription
$4,000.00Sign upAnnual Subscription
$1,000.00Sign upQuarterly Subscription
$350.00Sign up
Recent Posts
- Bull Scan for 10-14-26
- Premium Earnings 10-13-26: Fastenal and Morgan Stanley
- Bull Scan for 10-13-26
- Premium Earnings 10-12-26: Citigroup and Johnson & Johnson
- 4 Trade Ideas Wells Fargo: Bonus Idea
- 5 Trade Ideas for Monday: AbbVie, Airbnb, Affirm, GE Aerospace and Walmart
- Top Trade Ideas for the Week of October 12, 2026: The Rest Premium
- Top Trade Ideas for the Week of October 12, 2026: The Best
- SPY Trends and Influencers October 10, 2026
- Macro Week in Review/Preview October 9, 2026
Archives