Looking Ahead: The Dollar
- Posted by Greg Harmon
- on December 28th, 2010
As a reminder, this series of articles as a collection are intended to help frame the potential outcomes of the coming 12 months or so of the global markets. They are not intended to be a forecast per se, but to provide longer term deeper insight based on the current market structure. Each article is complete in itself, but the series together will provide a whole world focus, and as usual they will focus on price action, meaning there will be charts. Full schedule is here.
US Dollar Index
The US Dollar has played a major role in the markets recently and been the talk of every news program. It is important to market analysis for several reasons. The strength or weakness of the dollar impacts trade flows, money flows and inflation expectations. Below is a 20 year monthly chart of the US Dollar Index.
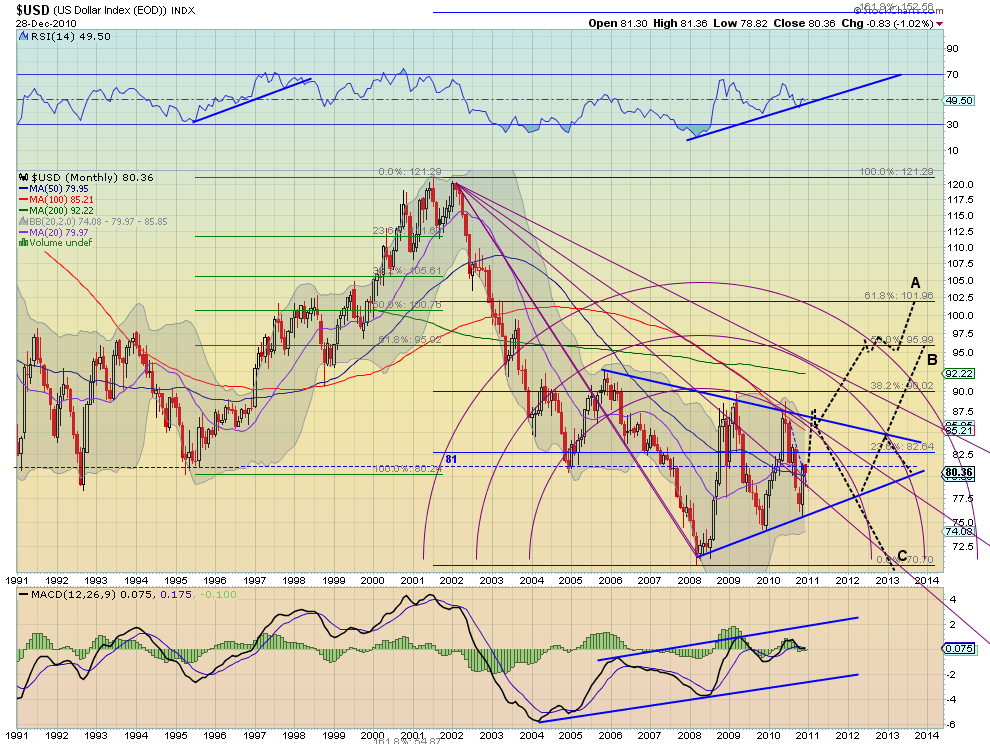
The first thing that jumps out at me from this chart is the trend support line at the 80 to 82 area. Notice how this trendline is also the centerline, approximately, for the symmetrical triangle at the right side of the chart, the starting level for the move higher in 1995 and a mini-Fibonacci level for the move down from 2001. This area has some real meaning. It is no wonder that the Index has been fluctuating around it for 5 years now. Next notice that the Fibonacci retracement levels from the strengthening move in the index from 1995 until 2001 match up in two places with those of the move from 2001 down to the bottom in 2008. The one just under 96 is almost to the penny, and the one near 101 is slightly more that 1% different. These will also hold some memory and power. The RSI has been trending higher during the consolidation period and the MACD has also been channeling higher. The shorter monthly SMA’s are flattening out, while the slope on the longer SMA’s is decreasing. The 20 month SMA has bottomed and the 50 month is nearly there as well. The inside Fibonacci arc has held up during the coiling as resistance to the upside, coinciding with the downtrend line of the triangle. Finally the Bollinger band width has been nearly cut in half over the last 2 years.
US Dollar Index – Long term target 94 -105
Typically the bias for a symmetrical triangle to resolve would be a continuation of the previous move, along path C. With the flattening SMA’s and rising trend in RSI, I expect it to resolve higher either along path A or B, with A the most likely. The actual target can be obtained 2 ways. First the expected move out of a symmetrical triangle is equal to the height of the triangle at its widest point added to the break out level. The triangle is 20 points wide in early 2008 and that added to the 85 break out level yields the high end estimate of 105. Another measure is to look at the RSI move from mid 1195 to mid 1998. During this move the Index moved from 80 to 102, or 22 points. By adding the 22 points to the 72 level when RSI bottomed a target of 94 is obtained. Note the previously mentioned sticky levels of 96 and 101 are within this range as well and could act as magnets both to draw the Index there and then to keep it from leaving. For the point and figure crowd the current price objective on a 3×1 reversal chart with a 1 point box size is 115. The cross of the Fibonacci fan and arc near the projected breakout point might cause a stall, and then another stall where the Fibonacci arc touches the Fibonacci line at 96. This gives timing of the move up to the target of approximately mid 2012.
(As always you can see details of any individual charts and more on my twitter feed and on chartly.)
If you like what you see above sign up for deeper analysis and trading strategy by using the Get Premium button above. As always you can see details of individual charts and more on my StockTwits page.
The information in this blog post represents my own opinions and does not contain a recommendation for any particular security or investment. I or my affiliates may hold positions or other interests in securities mentioned in the Blog, please see my Disclaimer page for my full disclaimer.
blog comments powered by Disqus
-
 Gregory W. Harmon CMT, CFA, has traded since 1986 and held senior positions including Head of Global Trading, Head of Product Development, Head of Strategy and Director of Equity. (More)
 -
Subscribe to Dragonfly Capital Views
Lifetime Subscription
$4,000.00Sign upAnnual Subscription
$1,000.00Sign upQuarterly Subscription
$350.00Sign up
Recent Posts
- Bull Scan for 10-14-26
- Premium Earnings 10-13-26: Fastenal and Morgan Stanley
- Bull Scan for 10-13-26
- Premium Earnings 10-12-26: Citigroup and Johnson & Johnson
- 4 Trade Ideas Wells Fargo: Bonus Idea
- 5 Trade Ideas for Monday: AbbVie, Airbnb, Affirm, GE Aerospace and Walmart
- Top Trade Ideas for the Week of October 12, 2026: The Rest Premium
- Top Trade Ideas for the Week of October 12, 2026: The Best
- SPY Trends and Influencers October 10, 2026
- Macro Week in Review/Preview October 9, 2026
Archives