Looking Ahead: Shanghai Composite and Emerging Markets, EEM
- Posted by Greg Harmon
- on December 20th, 2010
Tonight starts the series with a look at the Shanghai Composite and the Emerging market ETF, EEM. As a reminder, this series of articles as a collection are intended to help frame the potential outcomes of the coming 12 months or so of the global markets. They are not intended to be a forecast per se, but to provide longer term deeper insight based on the current market structure. Each article is complete in itself, but the series together will provide a whole world focus, and as usual they will focus on price action, meaning there will be charts. Full schedule is here.
Shanghai Composite
The movement in the Chinese economy has been a major influence over the US Markets. Action taken by the Chinese Government to slow their economy can send ripples around the world. I have used the Shanghai Composite as a gauge for that economy over the last year. Look at the monthly chart below.
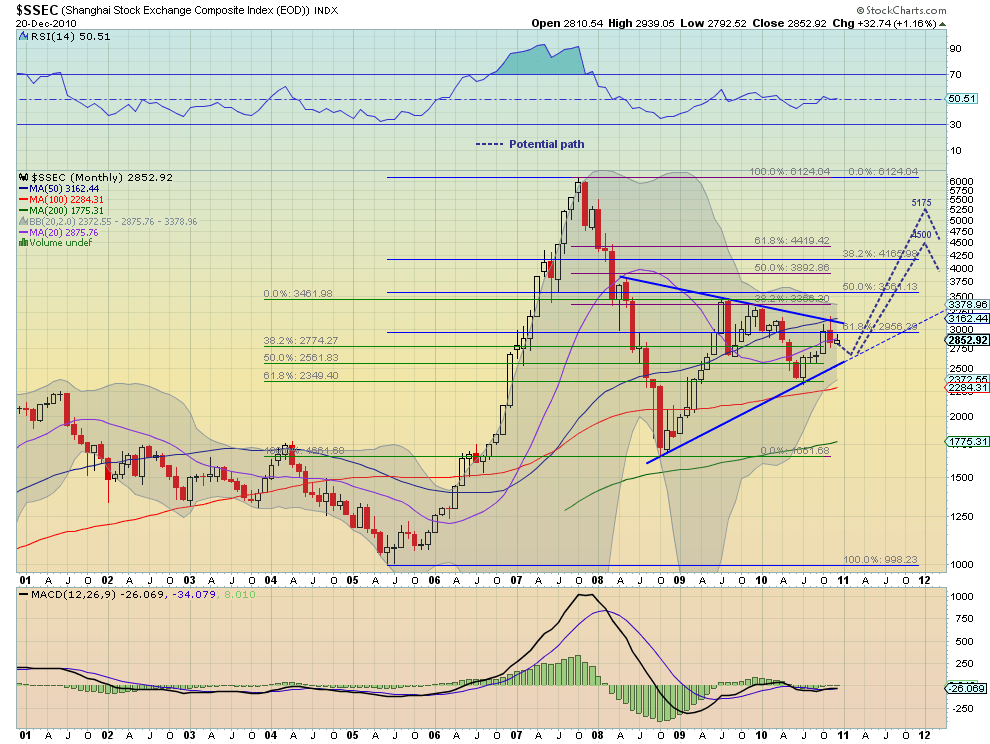
First some explanation of the lines. There are three sets of Fibonacci lines on this chart. The first, in blue, covers the range from the low point reached in June 2005 to the high attained in late 2007. The second, in purple, cover the range from that 2007 high to the low in October 2008, and the third, in green, from that 2008 low to the mid-2009 high. As these ranges have not been broken they are all still in play. There is also a 2 year long symmetrical triangle nearing its apex, noted by the hard blue lines. Finally, note the Bollinger bands have tightened considerably from their widest point at the start of symmetrical triangle and low in October 2008. This chart looks like a powder keg ready to explode. You can already see from the chart that I expect that explosion to be to the upside. But why? The weekly chart below is what biases my view higher.

Note that on the weekly chart that since touching the bottom rail of the symmetrical triangle in July, SSEC has tried to break out of the triangle higher and then found support at a new higher low on the 50 week SMA. It is now testing that triangle again. Also note that the RSI found support above 50 and has been rolling higher. This combination suggests to me another attempt higher.
SSEC – long term target of 4500 – 5175
Moving back to monthly chart, and the longer view, there are two potential targets to the upside that come out of the analysis. The lower one of 4500, stems from measuring the move from the October 2008 low to the July 2009 high, about 1700 points, and creating symmetry by adding that to the break out level of about 2800. The second target of 5175 comes from the expected move out of a symmetrical triangle. The peak of the triangle was about 2200 points and this is added to the break out level, of about 2975. This also is in agreement with a 3×1 point and figure chart of the SSEC using a a box size of 50 points, which currently has a bullish price objective of 4680. The speed of the rise on a break out may be slowed the stream of 100 point resistance levels going higher, at 3366, 3462, and 3561 created by the Bollinger bands.
Emerging Markets, EEM
Emerging markets have been another way to get an indication of how commodities and the US Dollar might behave. They also give clues to the overall global climate for risk. Below is the monthly chart for the EEM, the ETF that tracks emerging markets.
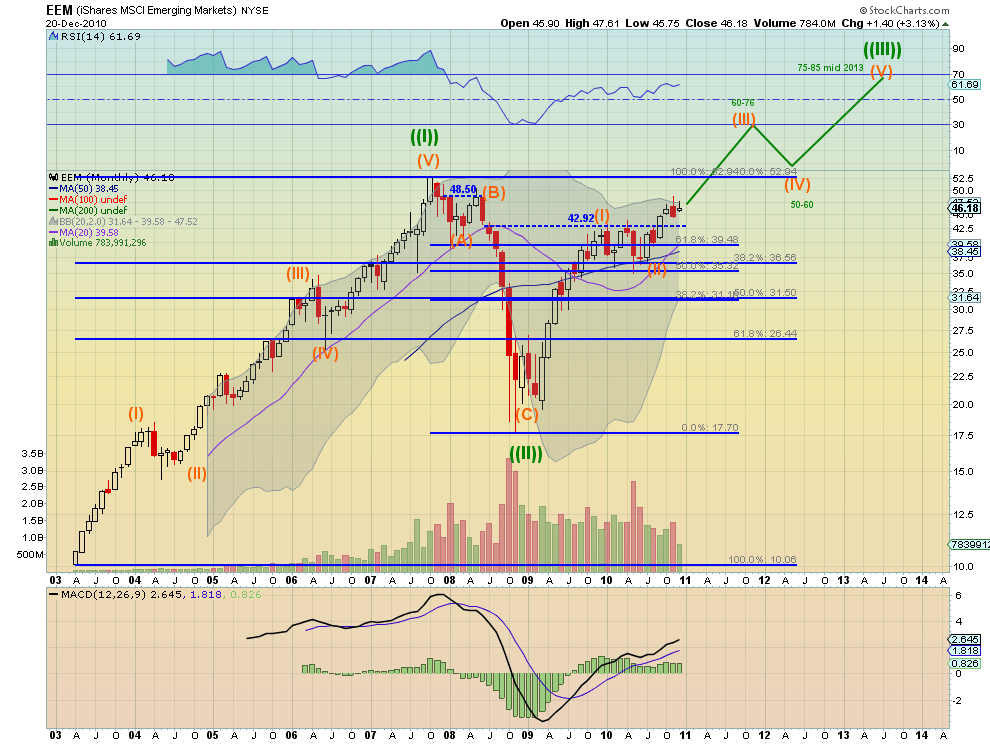
This chart jumped out at me as a prime candidate for Elliott Wave analysis. Emerging markets were not really possible for to invest in until recently on a broad scale making for a perfect starting point. The ETF began in a motive impulse wave mode at the super cycle level and had its first wave ((I)) rise from the initial low of 10.06 to 52.94. This wave count is noted in green. This was corrected by the second wave ((II)), a zig zag, back to 17.70 or more than 80%. I have also noted the sub wave count in orange. It is now in the third wave of the motive impulse wave. Within that wave it has gone through the first impulse move higher (I) to 49.92 and then corrected in a normal flat wave (II), and is now starting the third wave higher (III). Or is it still in the first wave and not yet ready to correct. You can already see my interpretation but let me explain it using the weekly chart below.
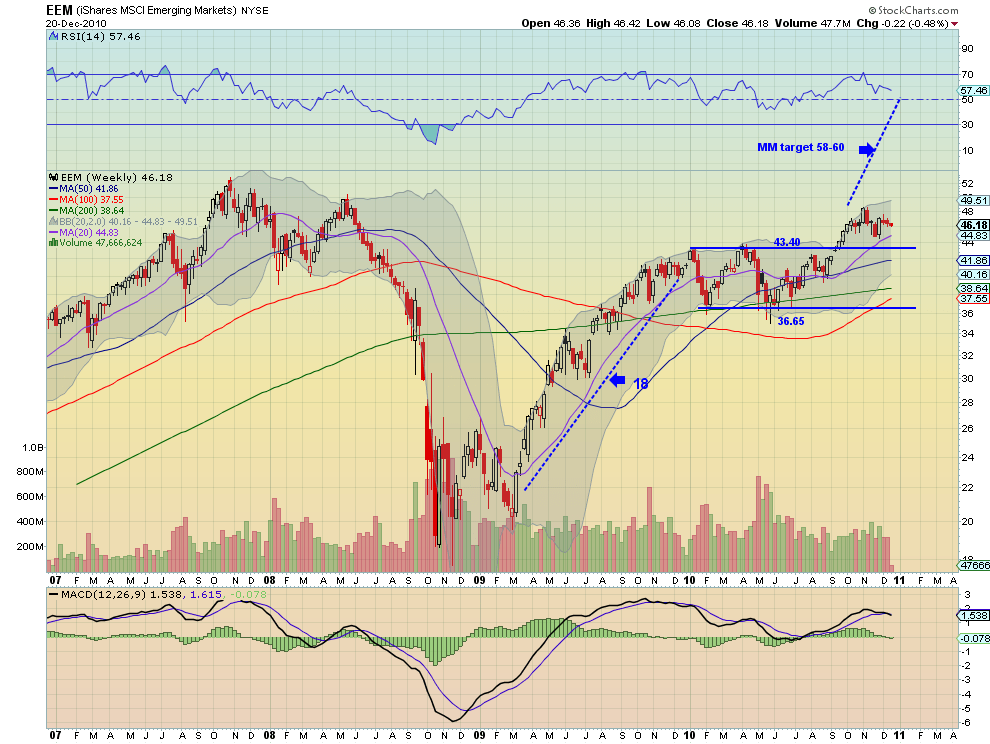
The weekly chart shows that EEM broke out of a long channel a few months ago after a large run up from about 22 to the channel at 40. It may look to retest the channel but the expectation is that the channel will act as a bull flag and the mid point of a move higher which from the weekly would measure to between 58 and 60.
EEM – LT target 75-85
Elliott rules require that the move must run at least to 60, because wave (III) cannot be shorter than wave (I). The upper approximation of 76 comes from adding 161.8% of wave (I) to the end of wave (II). So the target of sub-wave (III) is 60-76. From there the corrective wave (IV) is likely to correct downward, perhaps as a zig zag, as the previous corrective wave was a flat. I have incorporated at 38.2% retracement of wave (III) to come up with 50 to 60 as the target for wave (IV). From there I have added the length of wave (I) to get a target for super cycle wave ((III)) of 75 to 85. This also fits with the current 3×1 point and figure chart for EEM using a a box size of 1 point which has a price objective of 71. Also note that I have a target of mid 2013 for this to occur, based on symmetry to wave ((I)). This would be about 4 and 1/2 years for each super cycle wave.
(As always you can see details of any individual charts and more on my twitter feed and on chartly.)
If you like what you see above sign up for deeper analysis and trading strategy by using the Get Premium button above. As always you can see details of individual charts and more on my StockTwits page.
The information in this blog post represents my own opinions and does not contain a recommendation for any particular security or investment. I or my affiliates may hold positions or other interests in securities mentioned in the Blog, please see my Disclaimer page for my full disclaimer.
blog comments powered by Disqus
-
 Gregory W. Harmon CMT, CFA, has traded since 1986 and held senior positions including Head of Global Trading, Head of Product Development, Head of Strategy and Director of Equity. (More)
 -
Subscribe to Dragonfly Capital Views
Lifetime Subscription
$4,000.00Sign upAnnual Subscription
$1,000.00Sign upQuarterly Subscription
$350.00Sign up
Recent Posts
- Bull Scan for 10-14-26
- Premium Earnings 10-13-26: Fastenal and Morgan Stanley
- Bull Scan for 10-13-26
- Premium Earnings 10-12-26: Citigroup and Johnson & Johnson
- 4 Trade Ideas Wells Fargo: Bonus Idea
- 5 Trade Ideas for Monday: AbbVie, Airbnb, Affirm, GE Aerospace and Walmart
- Top Trade Ideas for the Week of October 12, 2026: The Rest Premium
- Top Trade Ideas for the Week of October 12, 2026: The Best
- SPY Trends and Influencers October 10, 2026
- Macro Week in Review/Preview October 9, 2026
Archives