Macro Week in Review/Preview December 17, 2010
- Posted by Greg Harmon
- on December 17th, 2010
Last week’s review of the macro market indicators suggested equity markets could continue higher and longer term they looked very bullish. The shrinking Volatility Index looked only to help this trend. US Treasury Bonds looked to peak soon and the reverse to resume their trend lower. Crude Oil and Gold were preparing to move and the US Dollar Index looked stronger. The Shanghai Composite looked to break the flag, probably lower and the Emerging markets ETF would bounce around as it consolidates in a longer term trend that looks higher.
As it turns out the Volatility Index continued lower, but the equity markets spent the week consolidating in a tight range at their highs. Treasuries did move higher Monday and then topped and rolled to new lows before a bounce Friday. Gold and Crude Oil started higher with Gold then falling back but bouncing Friday and Oil holding. The US Dollar Index stumbled early in the week but found support and ran higher at the end. How does this play into the pre-holiday action for next week? Let’s look at the charts.
(As always you can see these individual charts and more on my twitter feed and on chartly.)
Gold Daily

Gold Weekly

Gold moved up early in the week but after a shooting star on Wednesday sold off before settling on Friday. The 50 day Simple Moving Average (SMA) at has been support at 1369.41 and there is additional support below at 1360 then the trend line near 1340. The Relative Strength Index (RSI) near 50 and floating lower and the Moving Average Convergence Divergence (MACD) indicator growing more negative suggest there may be more downside in the short run. A move above 1400 would reconfirm the uptrend in the short term. From the weekly chart the trend is clearly higher, and Gold held support at the 1370 level. Below that there is further support at 1330 and 1316, the 20 week SMA. Resistance on the weekly chart is at 1420 and then the top rail at 1498.
West Texas Intermediate Crude Daily
West Texas Intermediate Crude Weekly

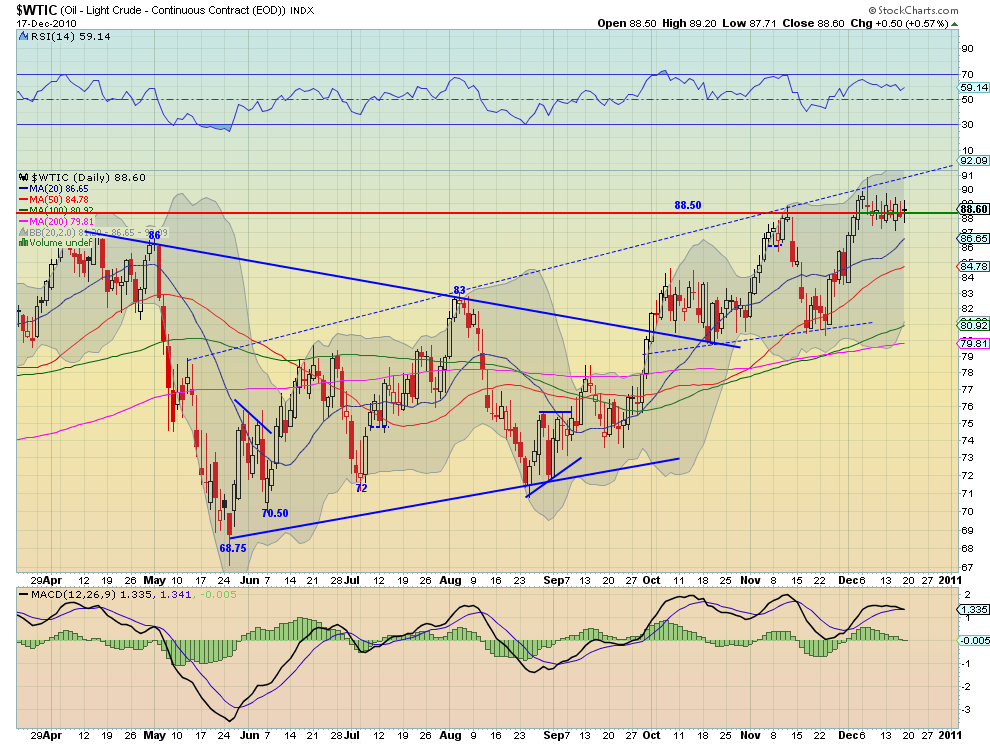
Crude Oil basically continued its bull flag, hovering around the 88.50 resistance and support level this week, after moving higher two weeks ago. The daily chart shows a rising resistance line, now at about 91 as the first stopping point on a move higher and then the round numbers of 95 and 100. A fall back will see support at 87 and then 86.00 to 86.33 and then 81 from the weekly chart below that. The weekly chart also shows the flag at the top of the break out move. It is more bullish than the daily chart with the RSI trending higher and the MACD positive. Look for the break to be higher.
US Dollar Index Daily
US Dollar Index Weekly

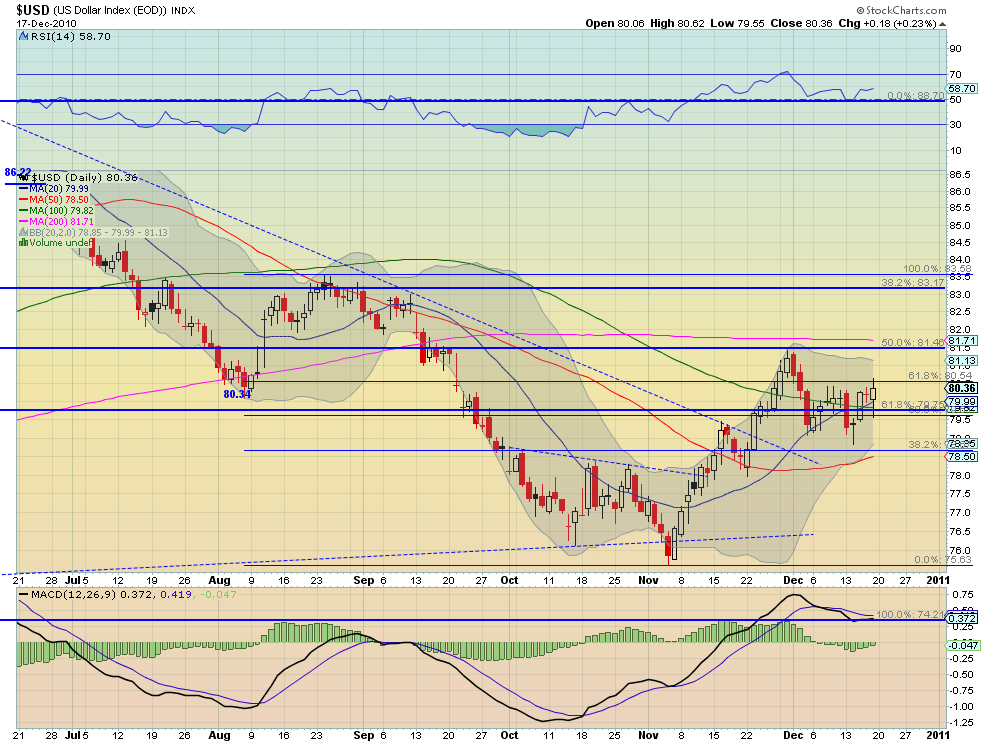
The US Dollar Index is consolidating on a daily timeframe between the 80.54, the 61.8% retracement of the move down from the August highs to the November lows, and 79. There are multiple other levels in between clogging up the works as well including the 100 and 50 day SMA’s and other Fibonacci support and resistance levels. The momentum oscillators on the daily charts give the bias to the upside. On the weekly chart, the Hanging man candle printed today at the resistance level of 80.28, if confirmed, points to a break of this uptrend and a move lower. The RSI on the weekly is flat lining as it hits 50 and there is resistance higher at the 50 and 100 week SMA’s at 80.83 then 81.23, suggesting that the upside may be limited. Support lower on the weekly chart comes at 79.50 then 78.
iShares Barclays 20+ Yr Treasury Bond Fund Daily
iShares Barclays 20+ Yr Treasury Bond Fund Weekly
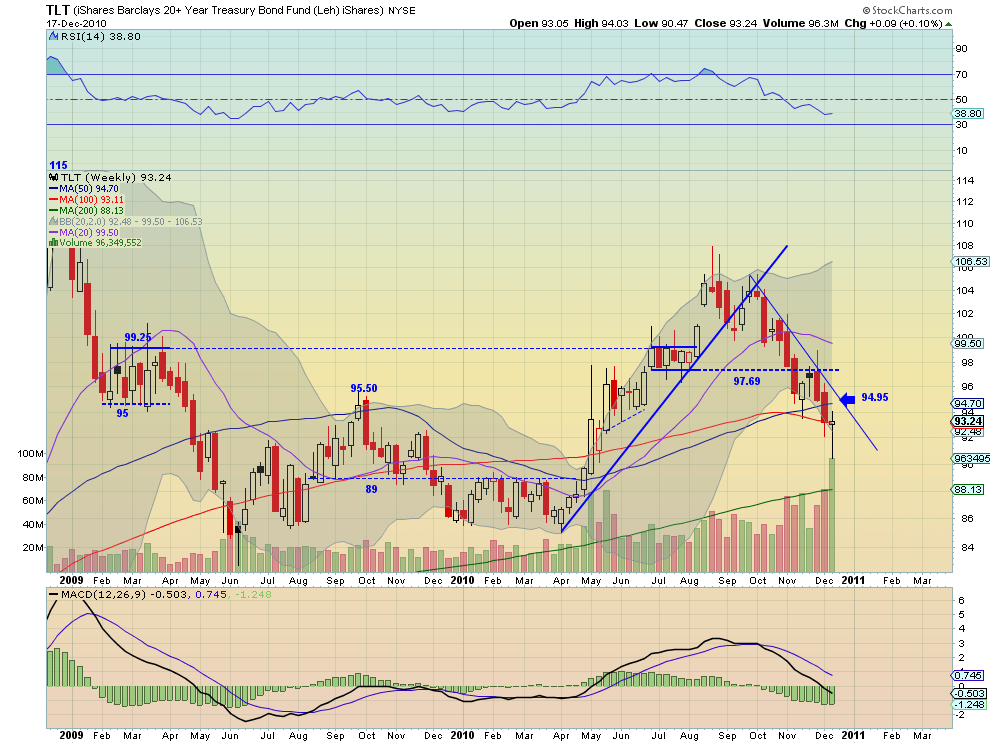
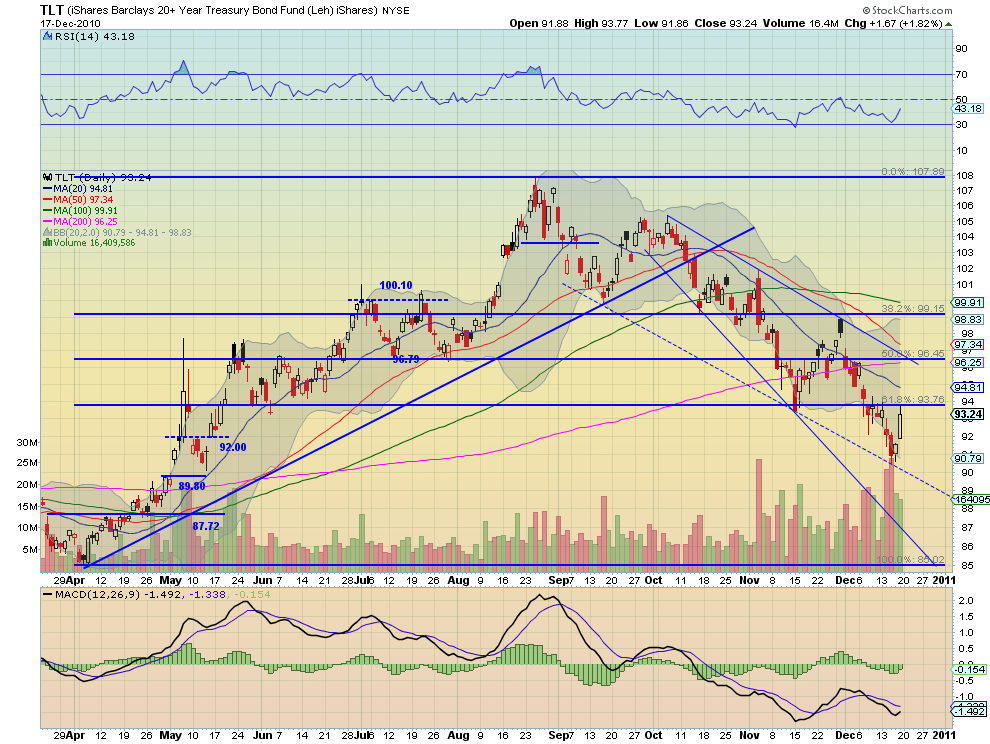
US Treasuries ended the week about where they started after setting new lows for this downtrend. Support was found at 90.50 when the TLT bounced off of the down trendline, but could not retake the 93.76 level, the 61.8% retracement of the up move from April to August. Resistance above that is at 94.81 the falling 20 day SMA and then 95.50. The Hammer printed on the weekly chart suggests that the move up may not yet be done, despite both the RSI and MACD suggesting further downside on the weekly chart. There is resistance on the weekly chart at 94.70, the 50 week SMA, and 94.95 the down trendline. If the downtrend resumes then there is support lower at 92 and 89.80 from the daily chart and 89 on the weekly chart.
Shanghai Stock Exchange Composite Daily
Shanghai Stock Exchange Composite Weekly
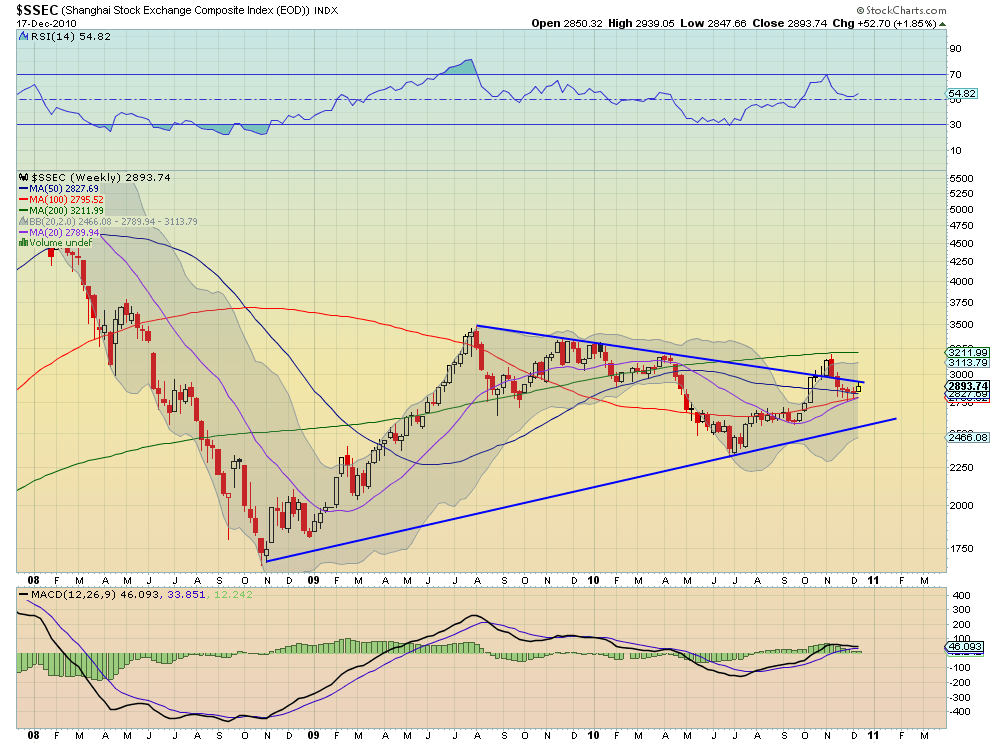
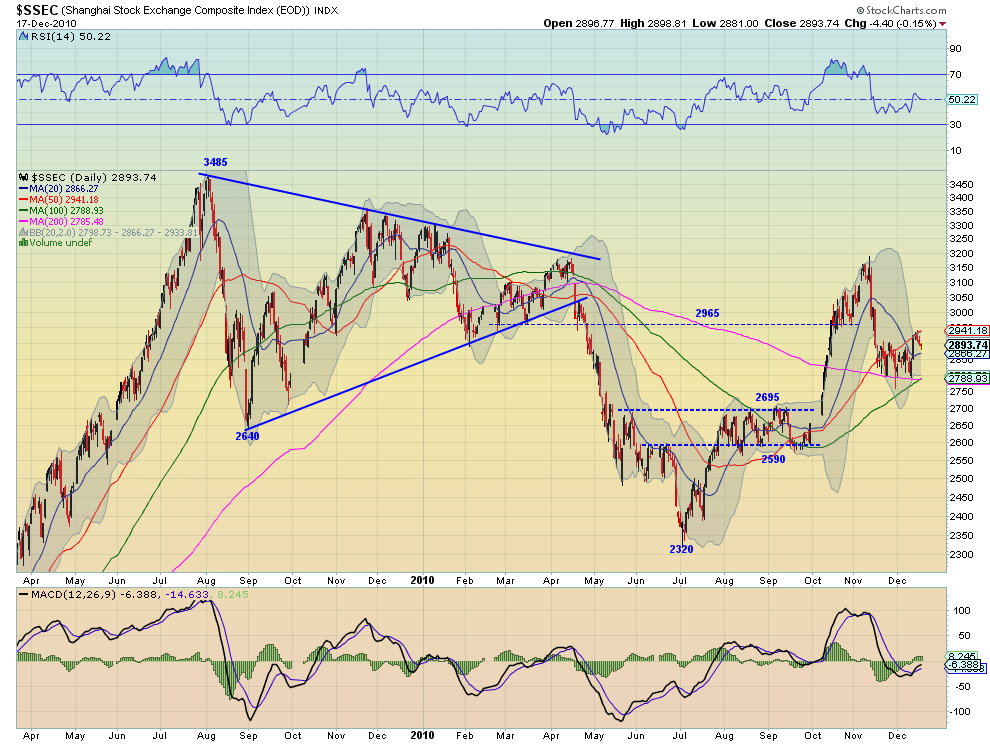
The Shanghai Composite broke higher on Monday after the Chinese government took the light approach to tightening by only raising reserve requirements. It stalled at the 50 day SMA as resistance and then fell the rest of the week. There is support lower at the 20 day SMA at 2866 and then the 100/200 day SMA cross near 2789. The MACD and RSI pointing lower suggest that the pullback might continue, but turning to the weekly chart there is support of the 20, 50 and 100 week SMA’s right below. The weekly chart also shows a second test of the top rail of the symmetrical triangle within a few weeks of the failed break out. If it gets through there is resistance higher at 322, the 200 week SMA, and target of 3940. The rounding RSI suggests it may now be moving into a bullish mode.
iShares MSCI Emerging Markets Index Daily
iShares MSCI Emerging Markets Index Weekly
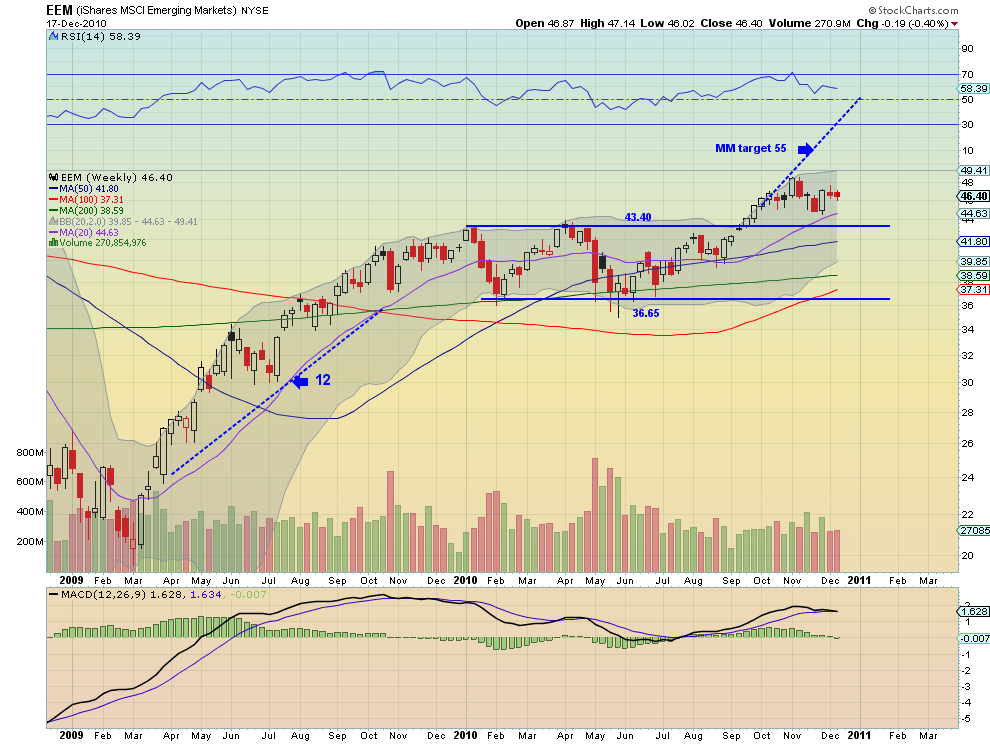
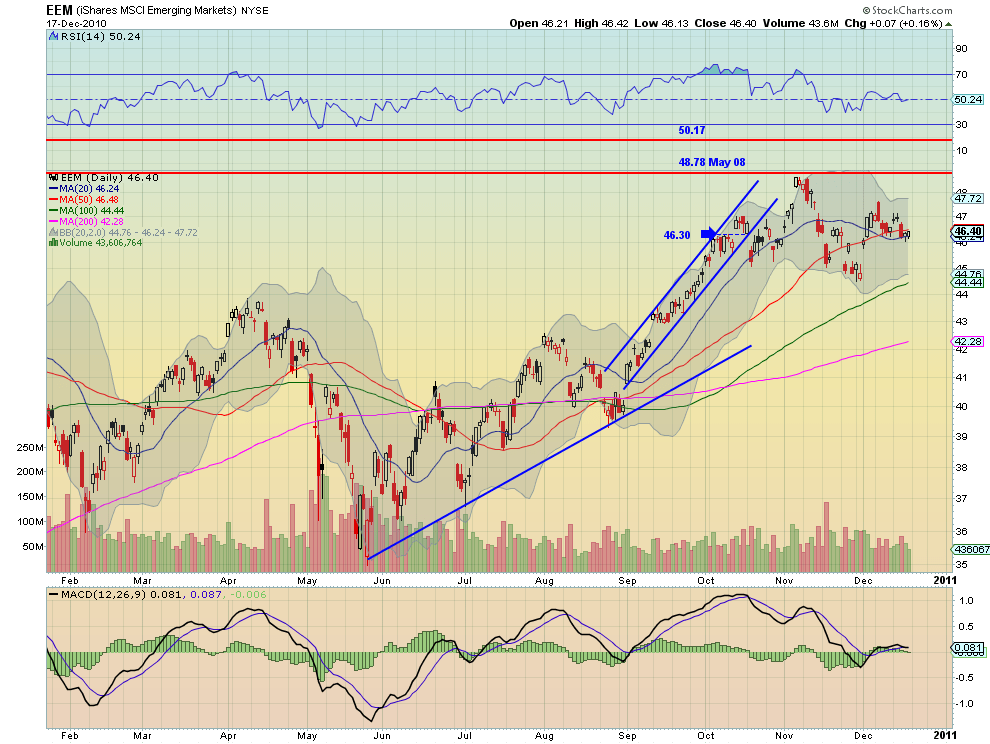
The emerging market ETF, EEM, looks like a scatter chart on the daily timeframe. There is an identifiable zone of support/resistance between 46.24 and 46.48 that contains the tangle of the 50 and 20 day SMA and the gap at 46.30. The small range candles make for a difficult view and the RSI near 50 and flat MACD do not add any color. Moving out to the weekly picture provides a bit of clarity. The EEM is in a bull flag after breaking out from a consolidation channel, and may be headed back to retest support at the channel at 43.40 if 44.63 does not hold. A successful hold sees resistance at 47 from the daily chart and then 48 from the weekly chart on the way to a target of 55 on a measured move.
VIX Daily

VIX Weekly

The Volatility Index lost touch with the 18 resistance level and then rocketed down late in the week. Near term support on the daily chart is at 15.50, but the RSI and MACD suggest the ride down is not over yet. The weekly chart shows a consolidation range lower at 12.40 and then several touches of support lower at 10. The RSI has not spent any major amount of time below 40 for more than 6 years and is currently at 41.63 suggesting that the bottom is near. Also the Bollinger bands on the weekly are starting to narrow. This all suggests that there is limited downside left.
SPY Daily
SPY Weekly
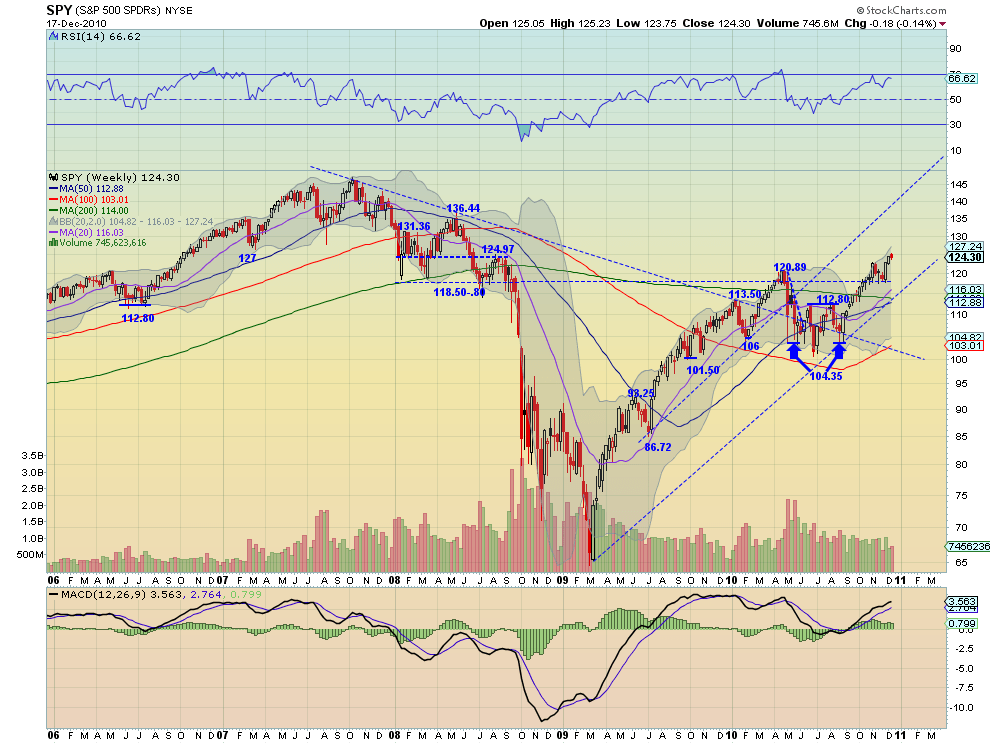
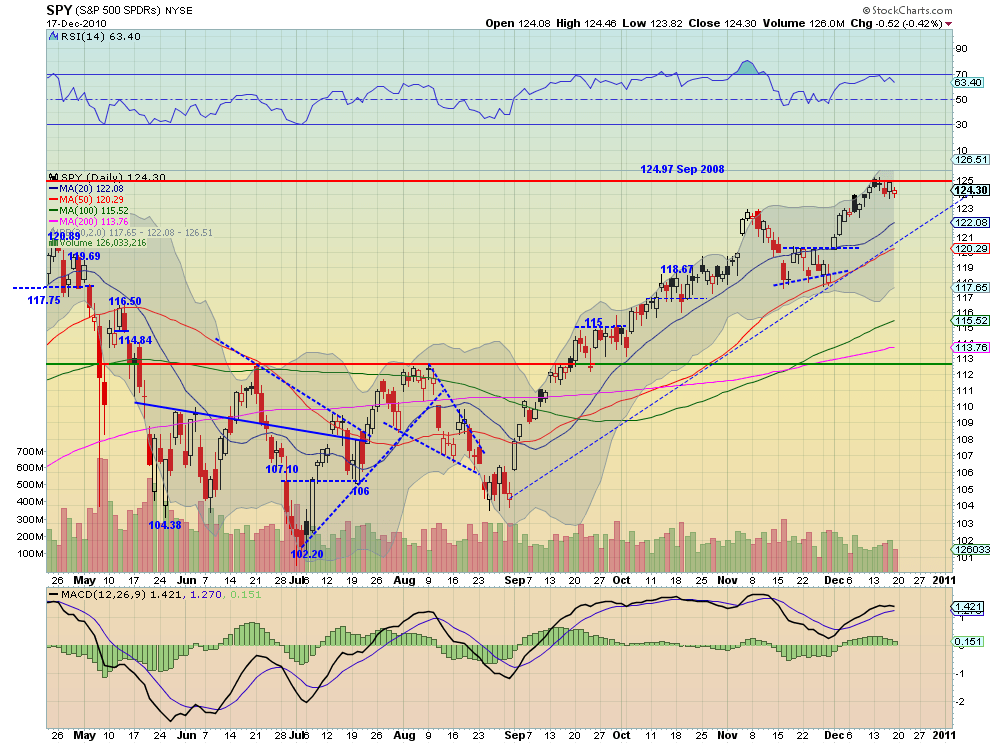
SPY hit the September 2008 high of 124.97 and stuck to it like a fly on flypaper. The SMA’s on the daily chart are all rising but the RS and MACD are starting to turn a little less positive. If that continues there may be a bit of a pull back. Support comes at 124 and then 123 on the daily chart before the 20 day SMA at 122.08. The weekly chart is more bullish as long as it holds above 120.89. Resistance higher on the weekly chart comes at 127 and then 131.36. The trend is still higher but there might be a small pullback soon.
IWM Daily

IWM Weekly
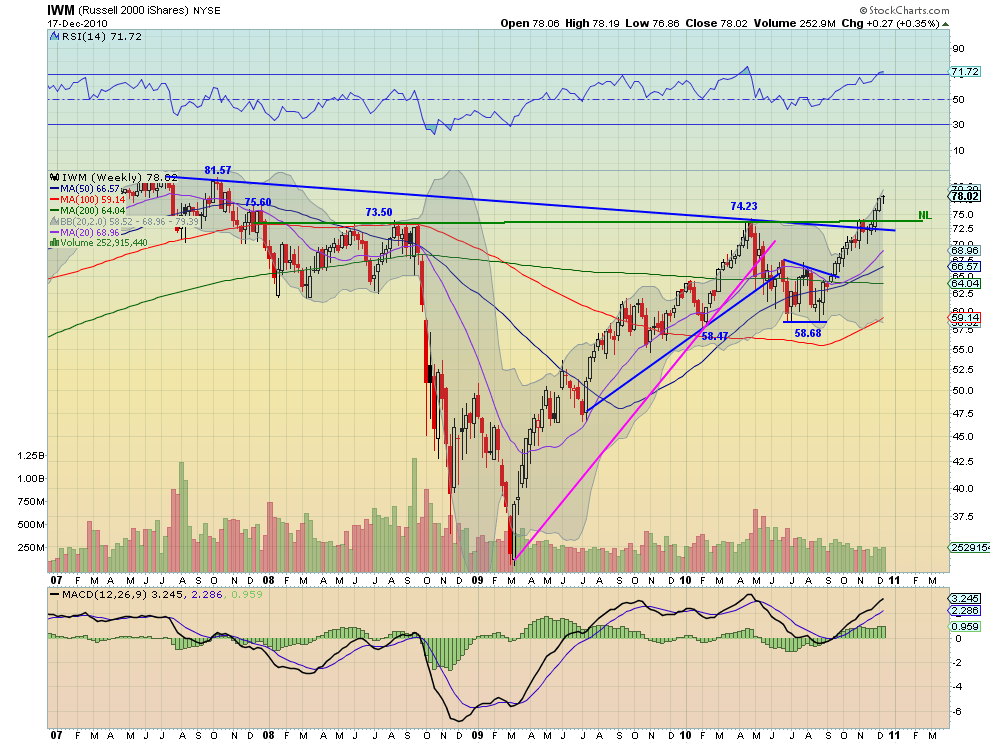
IWM broke through the December 2007 high of 76.75 two weeks ago and has been consolidating since. The SMA’s are look healthy for more upside, and the RSI although elevated on the daily chart is not extreme. Resistance on the upside comes at the November 2007 high of 79.10 next. Moving to the weekly chart, the price action looks very bullish. It is continues to push the top of the Bollinger bands, have recently broken an inverse Head and Shoulders neckline and an long term down trend line. The next level of resistance higher is at 81.57 from October 2007. The RSI and MACD on the weekly chart support a continued advance toward this interim target.
QQQQ Daily

QQQQ Weekly
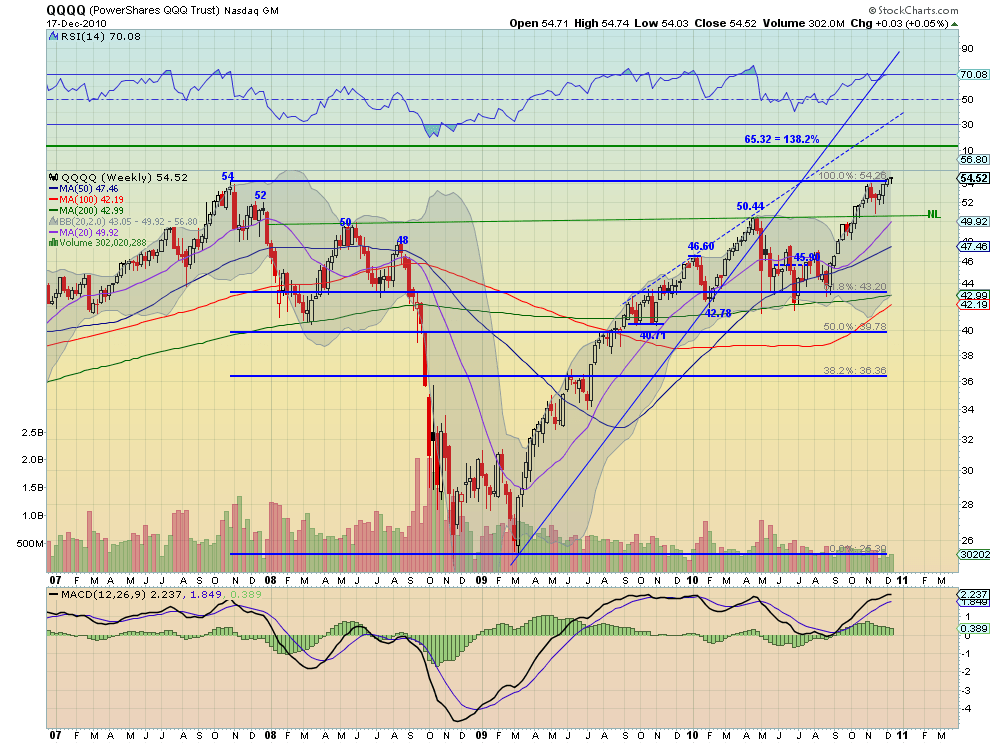
The Q’s are also consolidating at resistance from 2007, at 54.26 from October that year, with good looking SMA’s. The RSI and MACD on the daily chart suggest a slight weakening so a pullback on the short term is possible if this were to continue. On the weekly chart QQQQ continued higher printing a Hanging Man candle, another potentially bearish omen. But the long term view on the weekly chart is still bullish after breaking the neckline of its own inverse Head and Shoulders pattern. Support on a pullback would come at 553.57, the 20 day SMA and then 52.50 the 50 day SMA, before 52 and 50.00 to 50.44 from the weekly chart. If it can break through the resistance higher that the next resistance comes at 60 from November 2000.
So next week looks positive for Gold but with the short term potential to continue lower, and for Crude Oil to break the flag higher. The US Dollar Index is biased to the upside with a short term potential lower from the Hanging Man, while US Treasuries are biased lower, although have a little room higher before the turn. The Shanghai composite look to rally off of support higher but emerging markets look to meander higher. Volatility is headed lower still but has little room before strong support. Equities look to be flat to a small pullback short term but all appear better to the upside longer term.
Trade’m well.
If you like what you see above sign up for deeper analysis and trading strategy by using the Get Premium button above. As always you can see details of individual charts and more on my StockTwits page.
The information in this blog post represents my own opinions and does not contain a recommendation for any particular security or investment. I or my affiliates may hold positions or other interests in securities mentioned in the Blog, please see my Disclaimer page for my full disclaimer.
blog comments powered by Disqus
-
 Gregory W. Harmon CMT, CFA, has traded since 1986 and held senior positions including Head of Global Trading, Head of Product Development, Head of Strategy and Director of Equity. (More)
 -
Subscribe to Dragonfly Capital Views
Lifetime Subscription
$4,000.00Sign upAnnual Subscription
$1,000.00Sign upQuarterly Subscription
$350.00Sign up
Recent Posts
- Bull Scan for 10-14-26
- Premium Earnings 10-13-26: Fastenal and Morgan Stanley
- Bull Scan for 10-13-26
- Premium Earnings 10-12-26: Citigroup and Johnson & Johnson
- 4 Trade Ideas Wells Fargo: Bonus Idea
- 5 Trade Ideas for Monday: AbbVie, Airbnb, Affirm, GE Aerospace and Walmart
- Top Trade Ideas for the Week of October 12, 2026: The Rest Premium
- Top Trade Ideas for the Week of October 12, 2026: The Best
- SPY Trends and Influencers October 10, 2026
- Macro Week in Review/Preview October 9, 2026
Archives