Macro Month in Review/Preview November 2010
- Posted by Greg Harmon
- on November 30th, 2010
Last month in this space my Monthly Macro Review/Preview suggested that heading into November the charts looked positive for Gold, as well as the emerging market ETF. I was watching for resolution of the flag on US Treasuries, with a bias to the downside. Crude Oil was more mysterious and needed close attention to get a clue to its next direction. The US Dollar Index appeared to be headed lower. The equity index ETF’s, SPY, IWM and QQQQ all looked good for more upside on a monthly basis. The month did start with Gold, Oil and global equities moving up off of the US election results. The US Dollar Index and US Treasuries started the month lower. Mid month there were two market catalysts that added some volatility. These were the Chinese looking to stall their growth and the intensification of the European Sovereign debt crisis, initially with Ireland. So how did this impact the charts and what should we look for in December? Let’s go to the charts.
(As always you can see these individual charts and more on my twitter feed and on chartly.)
Gold Monthly

Gold did post a positive month as it continues to ride the upper bound of the Bollinger bands higher. The top rail of the rising wedge is also continuing to be resistance. It closed November right at the 1385 level after creating a new high intra-month. All of the Simple Moving Averages (SMA’s) continue to trend higher suggesting Gold has more upside in it. Adding to that bull case the Moving Average Convergence Divergence (MACD) indicator is also increasing and the Relative Strength Index (RSI), although elevated is pointing higher. Finally it is in a long term bullish rising channel. Resistance for December comes at 1405 and then the top of the channel at 1560. Support is at 1286. look for more upside.
West Texas Intermediate Crude Monthly

Crude Oil tested the April highs of 87.25 and the bottom of the channel from 2007 into 2008 at 88.50. It fell back but held above the 50 month SMA and the highs from the beginning of the year near 81. The MACD and RSI are pretty much in neutral still, not adding any clarity. The most interesting element of the chart is that the Bollinger bands have moved from a $130 range one year ago to a $30 range this month. the last time they were this tight was April 2007 just before Crude ran from $65 up to $150 over the next 18 months. The rising SMA’s give a bias to the upside on any break and make me a long term bull on Crude.
US Dollar Index Monthly

The US Dollar Index started the month just above the bottom rail of a tightening wedge near 75.90. After testing lower it rallied strongly all month up through the 20 and 50 month SMA’s. Since testing the top rail 6 months ago there has been a short term downtrend support line that has acted as resistance and did so again this month. Despite that, the monthly candle was very strong, much bigger than an average move and with very little shadow on top, closing almost at the high of the month. The SMA’s will act as supp to the downside now. If it gets through the short term down trendline then it can run to the 100 month SMA and then the top rail as resistance. The RSI is rising and the MACD is improving suggesting this is possible if not likely.
iShares Barclays 20+ Yr Treasury Bond Fund Monthly
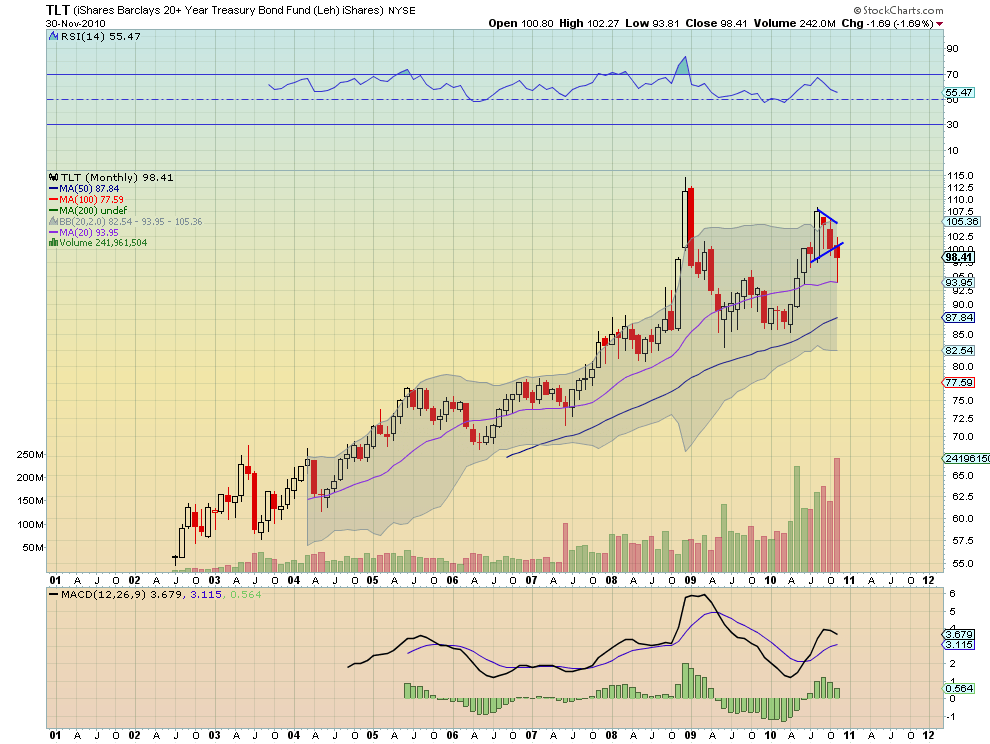
The proxy for US Treasuries, TLT, fell out of the wedge this month and went on to test the 20 month SMA below at 93.95 before rising back again. This was also the center of the Bollinger bands. A break of this level going forward could create a significant down move. The RSI and the MACD are both suggesting that the move lower that started 3 months ago will continue. There is interim support along the way lower at 95.15 from the October 2009 high, and resistance above 99 first at 101 and then 105. The final chip stacked against it is the 20 month SMA rolling lower and the accelerating volume on the sell off. This looks lower in the future.
iShares MSCI Emerging Markets Index Monthly
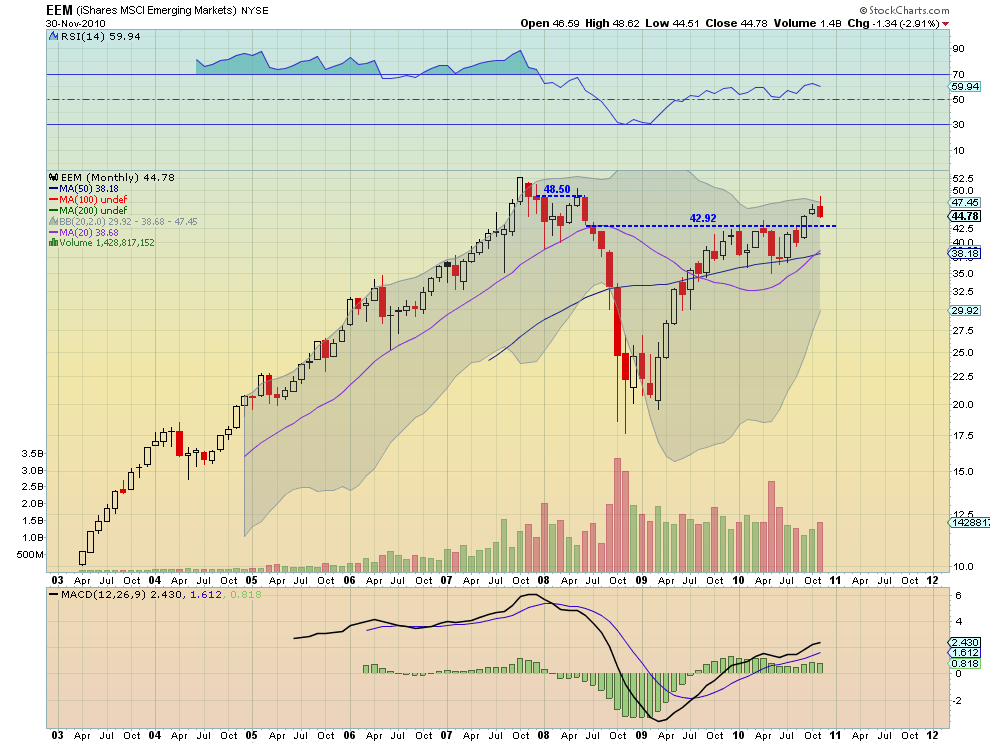
Emerging markets, using EEM as a proxy, started the month higher and then fell off to close near the low of the month at 44.78. The result was a Bearish engulfing candle, suggesting further downside to come. Support comes first at a retest of 42.92, the break out level from 3 months ago, and then at the 20 and 50 month SMA cross lower between 38.18 and 38.68. The Bollinger bands are tightening suggesting a bigger move may occur soon. The good news for EEM is that the rising SMA’s, coinciding with the midpoint of the Bollinger bands, should give it some support soon. Resistance higher comes at the early 2008 highs near 48.50.
Shanghai Composite Monthly

The Shanghai Composite Index is near the apex of a symmetrical triangle. Moves out of these triangles can be quite large and targets are established by measuring the width of the triangle at its largest and adding that to the break out. In this case the move could be over 1700 points. The Bollinger bands which have tightened from a range of over 5000 points to 1100 points add weight to a big move. The SMA’s are all pointing higher suggesting a positive long term trend but the index’s recent rise stalled at the 61.8% retracement of the move up from mid 2005 to late 2007. Above this level there is resistance at the 50 month SMA at 3142 and 3386. Support comes at the trend line at 2652.
VIX Monthly
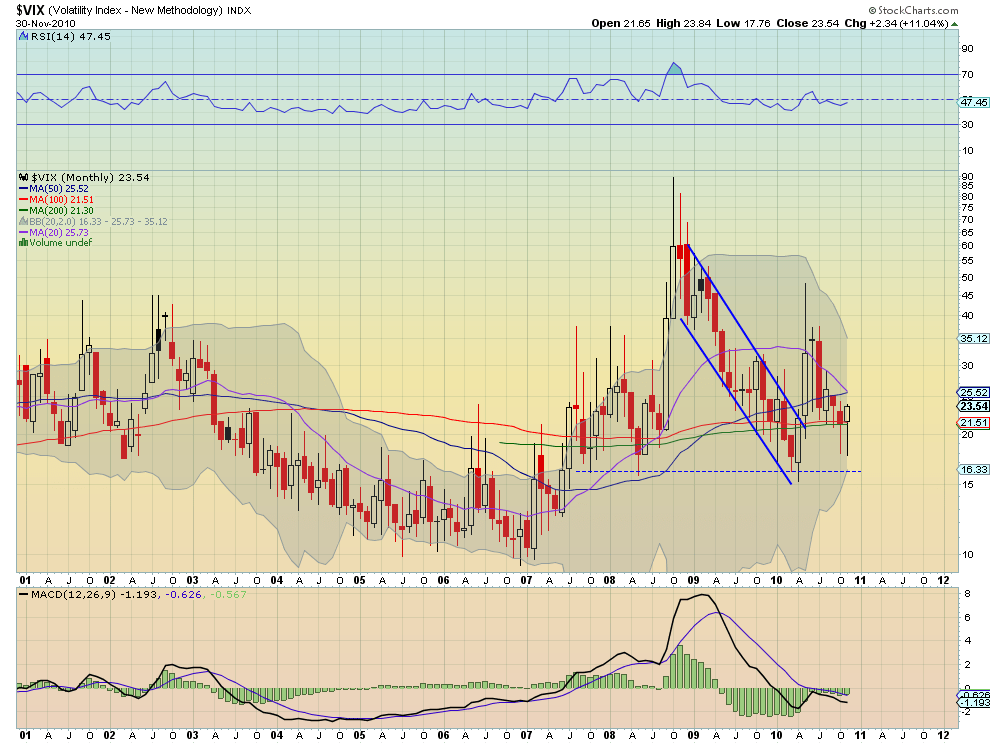
The Volatility Index has printed back to back Bullish hammer candles the last two months. It is sitting on support of both the 100 and 200 month SMA’s at 21.30-21.51 and has resistance higher at the cross of the 20 month and 50 month SMA’s near 25.50. The Bollinger bands are tightening on this chart as well suggest a move in the future, but with a flat MACD and RSI not giving any hints.
SPY Monthly
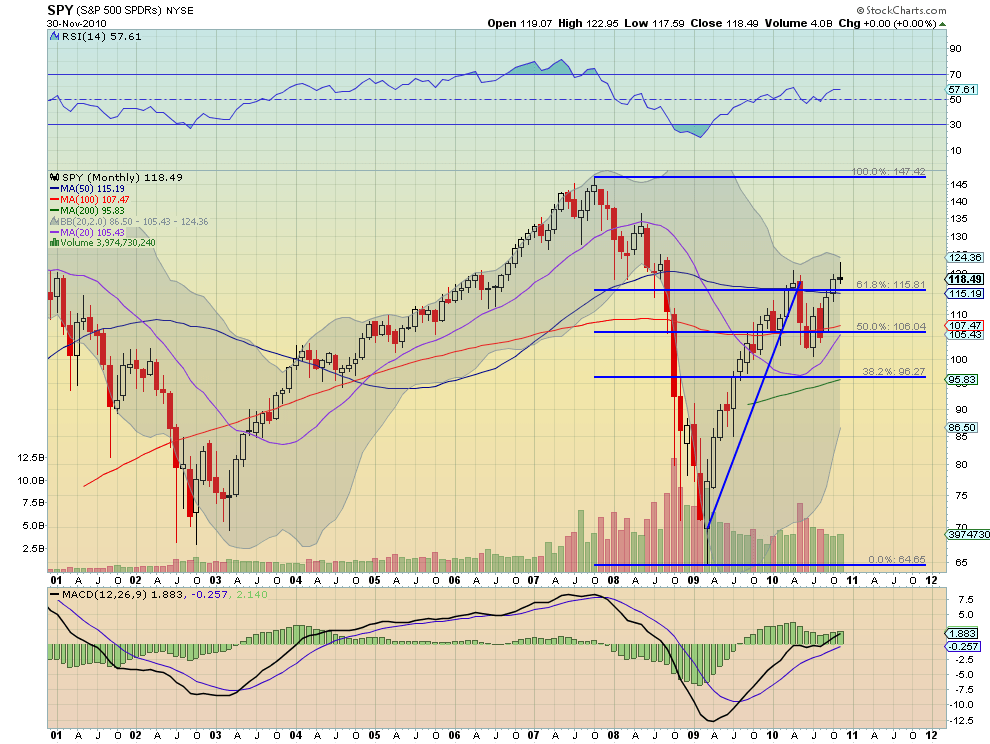
The monthly chart for the SPY printed a potentially bearish shooting star. It needs to be confirmed next month to create a downward move. On the positive side the month settled significantly above the 61.8% retracement of the move from the 2007 highs to the 2009 lows. If it can continue then the SMA’s will rise and resistance is first at 124.30. A failure will see support first at that Fibonacci level of 115.81 and then 107.42 lower. The trend is still up and the RSI and MACD do not suggest otherwise but as they are currently flat lined they also do not add any weight to a potential move higher. I am watching what happens at the 115.81 level and the RSI 50 level as indicators as to long term direction. For now I give the benefit of the doubt to the bulls.
IWM Monthly

The IWM is at resistance of slightly declining trend line at 72.80. This trendline is also the neckline of an Inverted Head and Shoulders pattern. If it were break the trendline higher the target for the pattern is 112. Thee is resistance higher at 74.36 from 2008 and then 81.67 before we can get excited about 100+. But the rising RSI and MACD suggest it could break through the trendline. If it does reject then there is support at the 67.5 to 68 area and then 66 below that. This chart is very bullish.
QQQQ Monthly
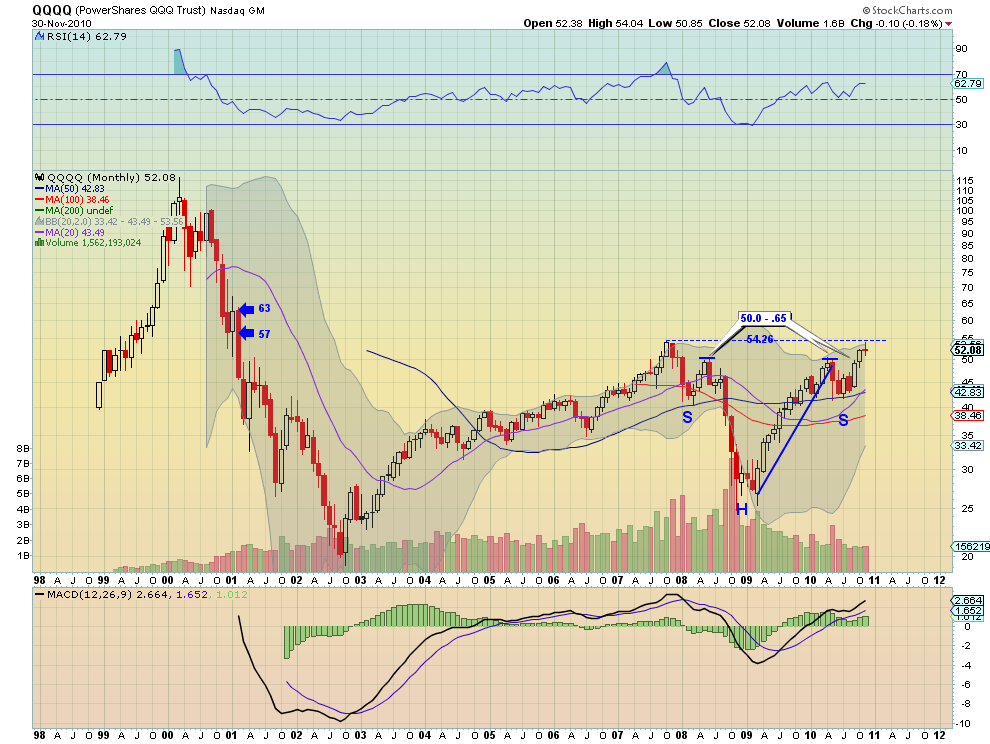
The QQQQ is also at resistance near 54.26, the high from 2007. Note also though that the QQQQ has its own Inverse Head and Shoulders pattern with a neckline near the 50 to 50.65 area. This is support now with 47 and then the 20 and 50 month SMA cross near 43 as support below. The target for this Head and Shoulders pattern is 75 but here is resistance at 57 and then 63 higher, before it can get there. It is at the top of the Bollinger bands and they are tightening, with rising SMA’s and MACD giving weight to a move higher. The lone dark spot is the star printed this month. It can signal indecision and if confirmed a move lower. The area between 50 and 54.26 is the battle ground for future direction.
The monthly charts for Gold and Crude Oil look positive for higher prices. The US Dollar Index also looks higher but is at resistance now so it may rest or pullback. US Treasuries appear to be headed lower as do the Emerging Markets, but with the Chinese market gearing for a major move. US equity markets look positive but need to get through resistance or risk a pullback.
If you interested in shorter time frames then here is the Week in Review/Preview from Saturday.
Good luck next month!
If you like what you see above sign up for deeper analysis and trading strategy by using the Get Premium button above. As always you can see details of individual charts and more on my StockTwits page.
The information in this blog post represents my own opinions and does not contain a recommendation for any particular security or investment. I or my affiliates may hold positions or other interests in securities mentioned in the Blog, please see my Disclaimer page for my full disclaimer.
blog comments powered by Disqus
-
 Gregory W. Harmon CMT, CFA, has traded since 1986 and held senior positions including Head of Global Trading, Head of Product Development, Head of Strategy and Director of Equity. (More)
 -
Subscribe to Dragonfly Capital Views
Lifetime Subscription
$4,000.00Sign upAnnual Subscription
$1,000.00Sign upQuarterly Subscription
$350.00Sign up
Recent Posts
- Bull Scan for 10-14-26
- Premium Earnings 10-13-26: Fastenal and Morgan Stanley
- Bull Scan for 10-13-26
- Premium Earnings 10-12-26: Citigroup and Johnson & Johnson
- 4 Trade Ideas Wells Fargo: Bonus Idea
- 5 Trade Ideas for Monday: AbbVie, Airbnb, Affirm, GE Aerospace and Walmart
- Top Trade Ideas for the Week of October 12, 2026: The Rest Premium
- Top Trade Ideas for the Week of October 12, 2026: The Best
- SPY Trends and Influencers October 10, 2026
- Macro Week in Review/Preview October 9, 2026
Archives