From the Charts: Macro Week in Review/Preview December 3, 2010
- Posted by Greg Harmon
- on December 3rd, 2010
In last week’s review of the macro market indicators it looked to bring caution to the markets again. Gold looked like it might rest or pullback some within the long term uptrend, the US Dollar Index and US Treasuries looked higher but might be topping at resistance shortly and Oil seemed primed to move higher. Emerging markets looked in trouble and headed lower. The bias in the Volatility Index was to the upside and combined with the potential for a stronger dollar the SPY, although undecided, is biased lower short term. IWM and QQQQ however seemed strong and biased to the upside short term. The bull case for equities, Gold and Crude Oil were all supported in the Monthly Macro Review/Preview from Tuesday.
Irish debt default concerns spilling into Spain,an ECB meeting, and the US Deficit Committee recommendations all hung like a cloud over the beginning of the week which led to Gold bucking the forecast and rising right out of the box Monday. Crude Oil tested higher and pulled back before rocketing up, as anticipated. The US Dollar Index and US Treasuries started higher and met resistance, falling off to end the week. Equities started the week running in place before retreating Tuesday. The retreat was short lived though with big gains Wednesday and Thursday and a rest on Friday, shrugging off a horrible Non-Farm Payroll report. I am adding the Shanghai Composite to the review this week to get a bit of a sharper focus on the non-US world. What do the charts tell us about next week? Let’s dive in.
(As always you can see these individual charts and more on my twitter feed and on chartly.)
Gold Daily
Gold Weekly

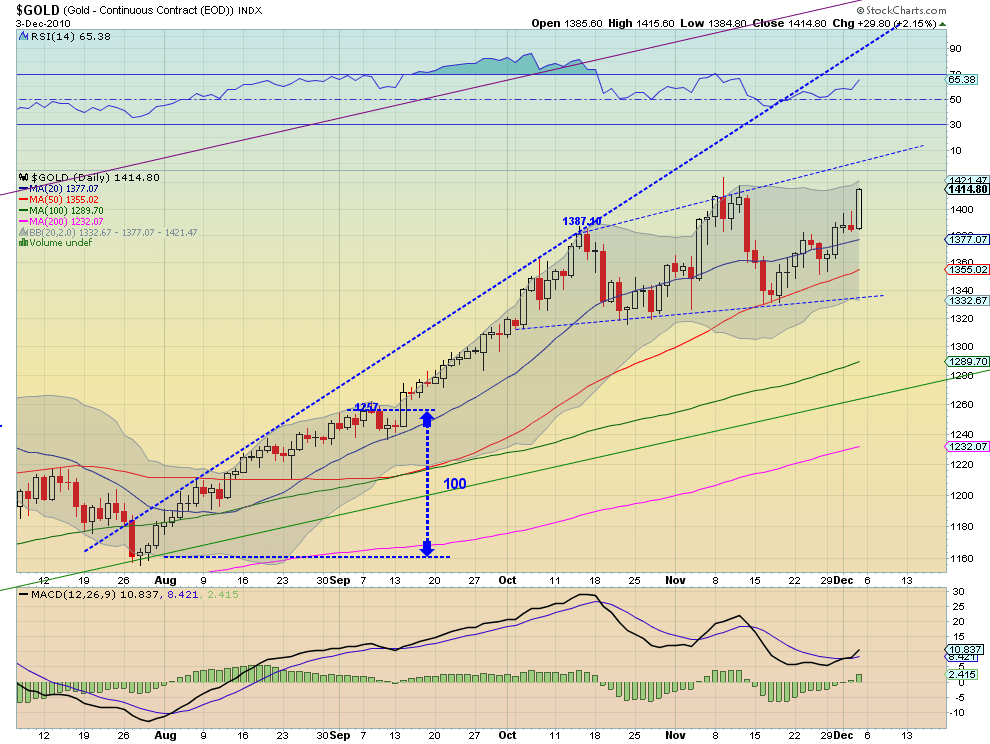
Gold had another great week closing on a new high at 1414.80 and with an extremely bullish nearly Marubozu candle. The daily chart shows that 1410 is now support with 1387 and then 1375 below that. Resistance is now found at 1438, the rising short term trendline. If the price action were not enough the Relative Strength Index (RSI) and Moving Average Convergence Divergence (MACD) indicator suggest further upside. The Simple Moving Averages (SMA’s) are all rising and show no signs of crossing any time soon. The weekly chart shows a break back above the mid-line of the rising channel, with resistance now at 1483 and support at 1406. The RSI on the weekly is still strong and the MACD appears to now be rising again.
West Texas Intermediate Crude Daily
West Texas Intermediate Crude Weekly

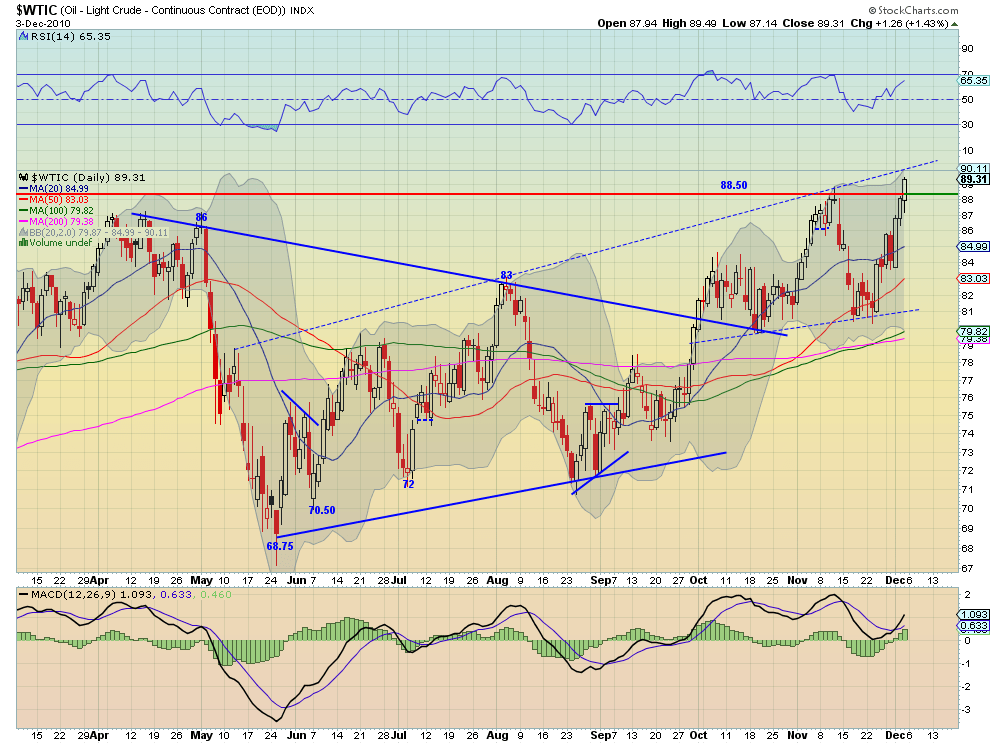
Crude Oil broke out this week. The daily chart shows a move above the 20 day SMA, a retest and then a bullish Three White Advancing Soldiers pattern breaking through the resistance at 88.50. This marks the bottom of the channel that Crude traded in during the last Quarter of 2008 with the top at 100, and can be seen on the weekly chart. The RSI and MACD are rising and increasing suggesting further upside, although there is some resistance near 90. The weekly chart shows a break above the recent highs near 87 and support for further upside from the RSI and MACD. Crude did pierce the top of the weekly Bollinger band though and this may cause a pause.
US Dollar Index Daily

US Dollar Index Weekly

The US Dollar Index halted its rise on a dime when the RSI on the daily hit 70 and on the weekly chart hit 50. This could be interpreted as the end of a short term up trend and confirmation of the longer term down trend. It also stalled near the 200 day SMA and the confluence of the 50 week and 100 week SMA’s, all of which are resistance higher. There is additional resistance at the 200 week SMA at 79.73, the 20 week SMA at 79.92 then the 100 day SMA at 80.06. It is on support at the 20 day SMA at 79.14, with the 50 day SMA below at 78.16 as support coinciding with the downtrend line. 6 SMA’s above, right on top of one and one further below. That is not bullish. It looks to head lower inn the short run with 79.50 and 79 providing added support.
iShares Barclays 20+ Yr Treasury Bond Fund Daily
iShares Barclays 20+ Yr Treasury Bond Fund Weekly

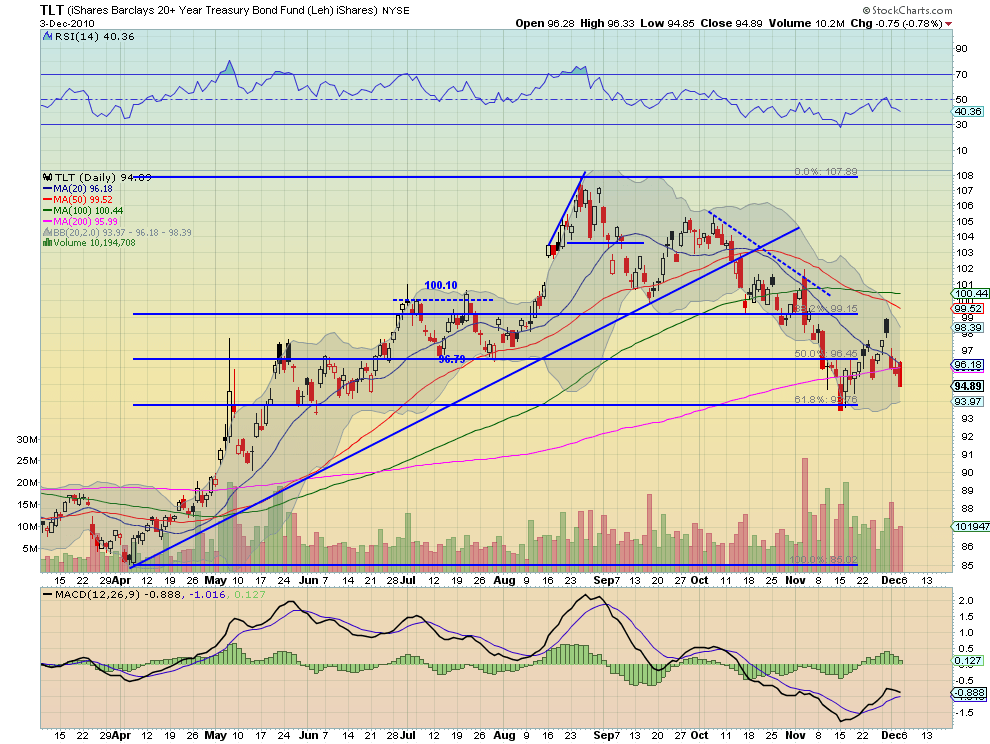
The TLT printed an island top reversal on Tuesday and fell to the intersection of the 20 say and 200 day SMA’s on the daily chart Wednesday. The 20 day SMA continued to press it lower and it ended the week with a big bearish engulfing candle well below the 200 day SMA. RSI is falling and MACD about to go negative. This is ugly. The weekly chart only brightens the picture by showing that support may not be that far away at the 50 week SMA at 94.43 or the 100 week SMA at 93.36 below. It rejected at resistance near 97.69 on the weekly chart. The rising volume on the sell off on the weekly chart is not a pretty sight for long holders. I would not be surprised if it runs through support before stopping near 92.
iShares MSCI Emerging Markets Index Daily
iShares MSCI Emerging Markets Index Weekly

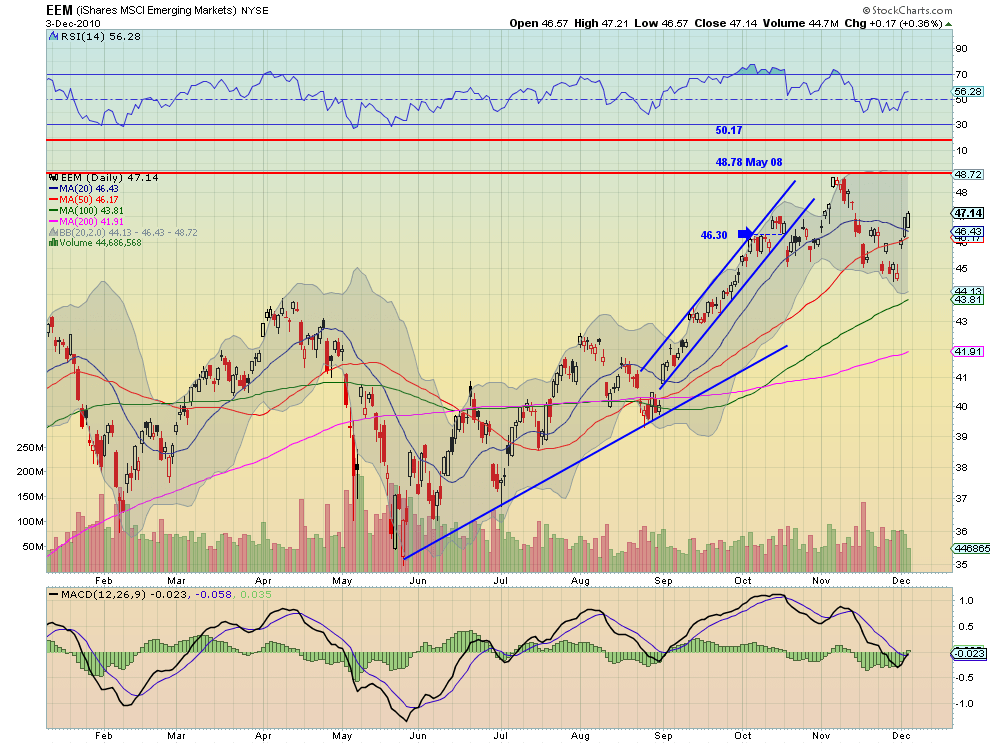
Emerging markets measured by the EEM have bounced like a ping pong match the last few weeks. This can be seen by the many gaps in the daily chart. After a bullish reversal candle on Tuesday EEM rose to the 50 day SMA Wednesday and vaulted higher. It has resistance at the 47.50 level and then the previous highs near 48.78. The MACD and RSI are now rising and suggest a potential run at the highs. The weekly chart shows a solid bounce off of 44.50 and a rising 20 week SMA adding support below, just above the channel at 43.40
Shanghai Stock Exchange Composite Daily
Shanghai Stock Exchange Composite Weekly

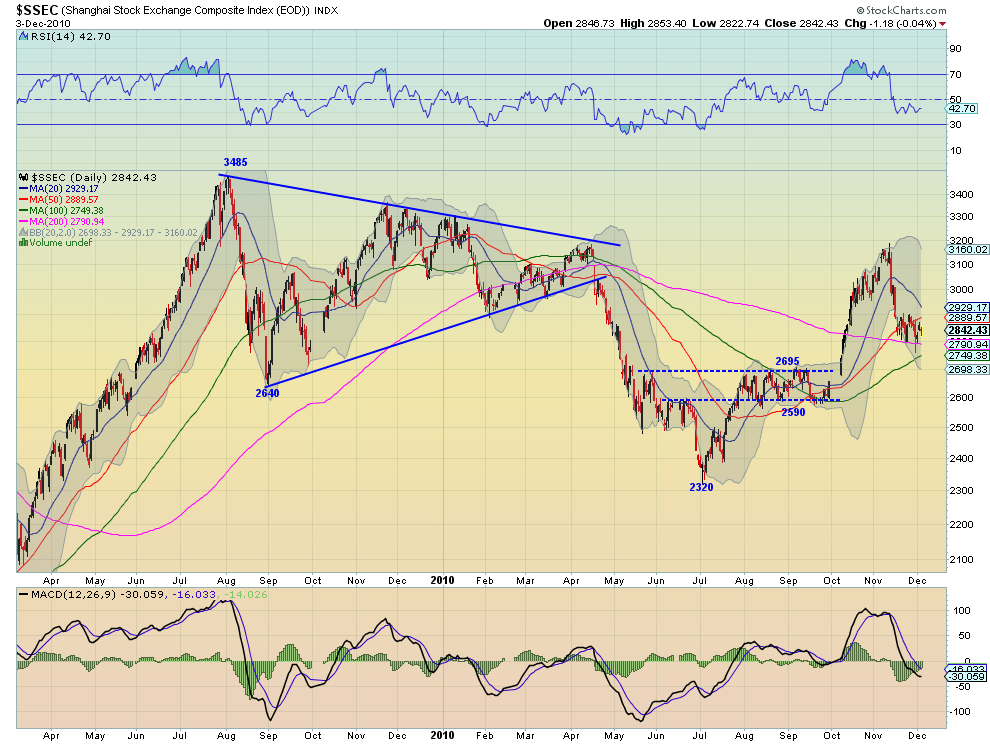
The newest addition to the Week in Review/Preview is the Shanghai Stock Exchange Composite Index. The daily chart is exhibiting a bear flag after falling hard from a break out move. It is tangled between the 50 and 200 day SMA’s, with the 20 and 100 day SMA’s creating a slightly wider range of support and resistance. The support of the 200 day SMA may be what it needs as the MACD is now waning and the RSI looks to have bottomed. The weekly chart shows a failed break out of a symmetrical triangle 5 weeks ago. It is holding on support of the 50 week SMA and testing the lower weekly SMA’s Watch for the channel at 2695 as support if the SMA’s do not hold and then the bottom of the Symmetrical triangle.
VIX Daily
VIX Weekly
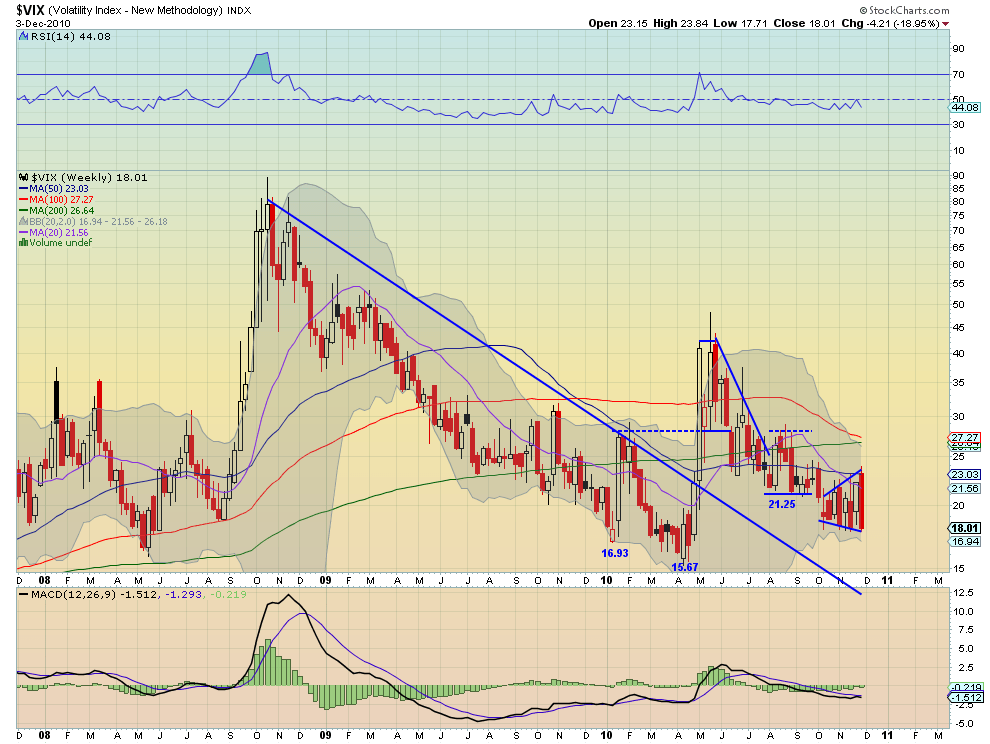
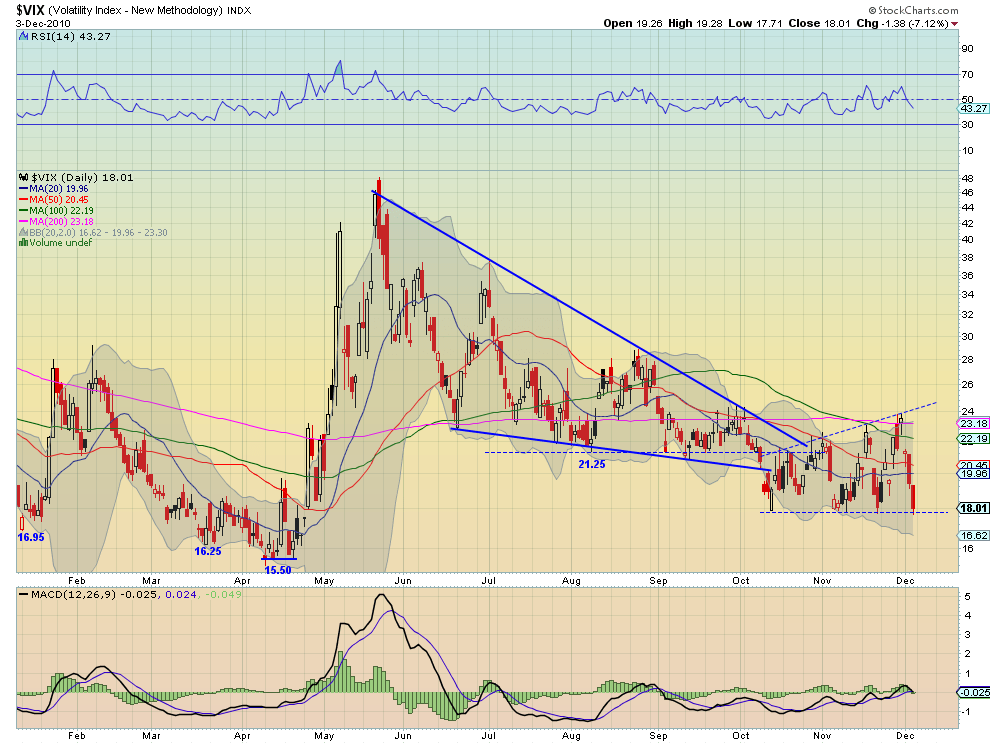
The Volatility Index posted the 4th consecutive higher high and the 4th consecutive touch and hold at 18, closing there today. It is just itching to bust a move either higher or lower. Currently it looks lower. The weekly chart shows that this week was a bearish engulfing candle. Support can be found lower at 16.95 and then 15.60ish. If it were to break higher then the resistance above the wedge would come at 26.64-27.27 on the weekly chart and then 28 on the daily chart.
SPY 60 minute

SPY Daily
SPY Weekly
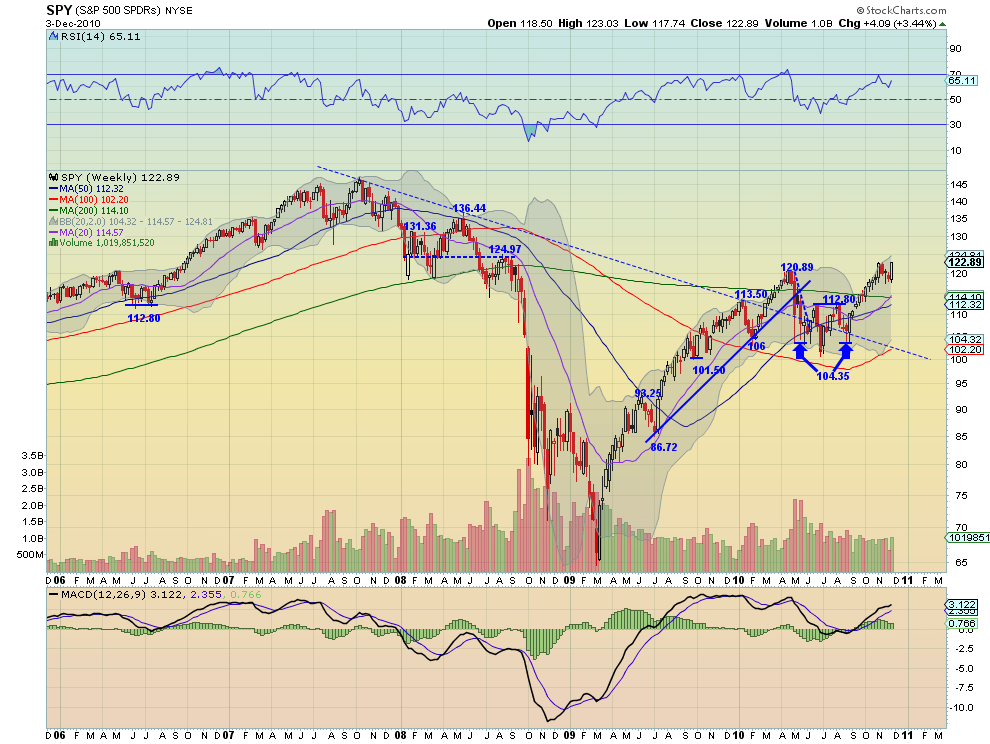
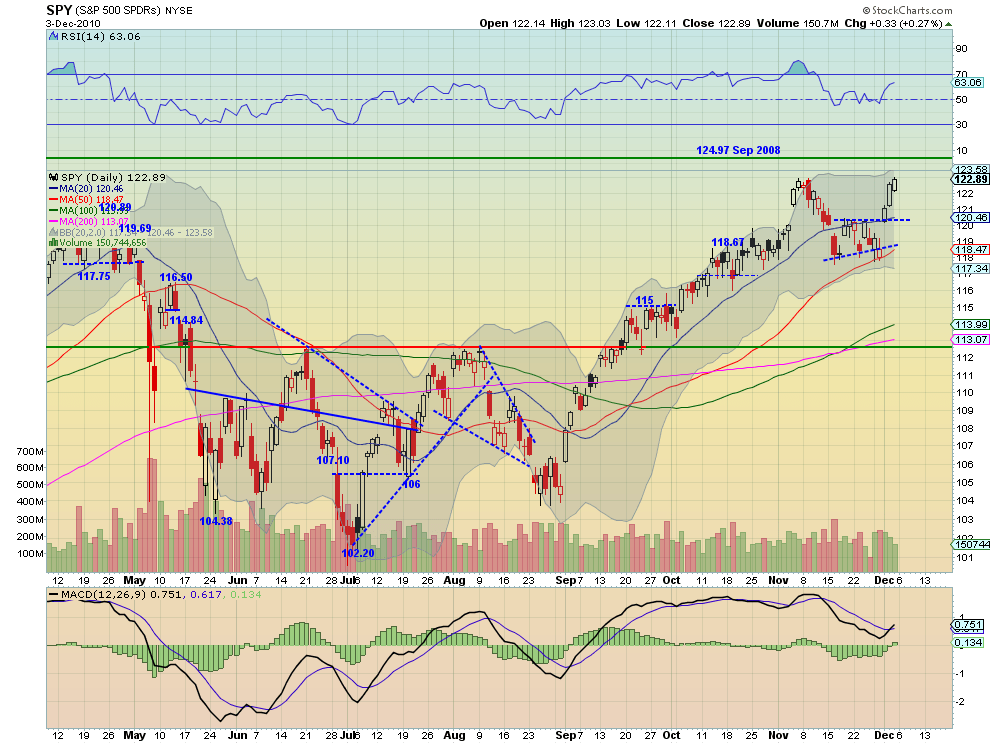
The hourly chart on the SPY shows a break of the descending trend line leading to the move higher beginning Wednesday. This happened when all of the hourly SMA’s were converging. Moving to the daily chart, the launch came off of a hold of the rising 50 day SMA. A gap up to the 20 day SMA and three strong candles then retraced the entire 3 weeks of downward movement. It is now at resistance of the previous November highs, and the 61.8% retracement of the move from the all time highs to the March 2009 bottom, all around 122.91 to 123. Above this level there is resistance at 124.97 on the daily chart, and the rising RSI and MACD support a move higher. The weekly chart looks higher as well. After hitting the top of the Bollinger band and setting off 3 weeks of small down movements, this weeks long white candle completed a bullish Rising Three Methods pattern. The weekly charts shows above the 124.97 resistance that the next level is at 127.32 and then 131.36.
IWM Daily
IWM Weekly
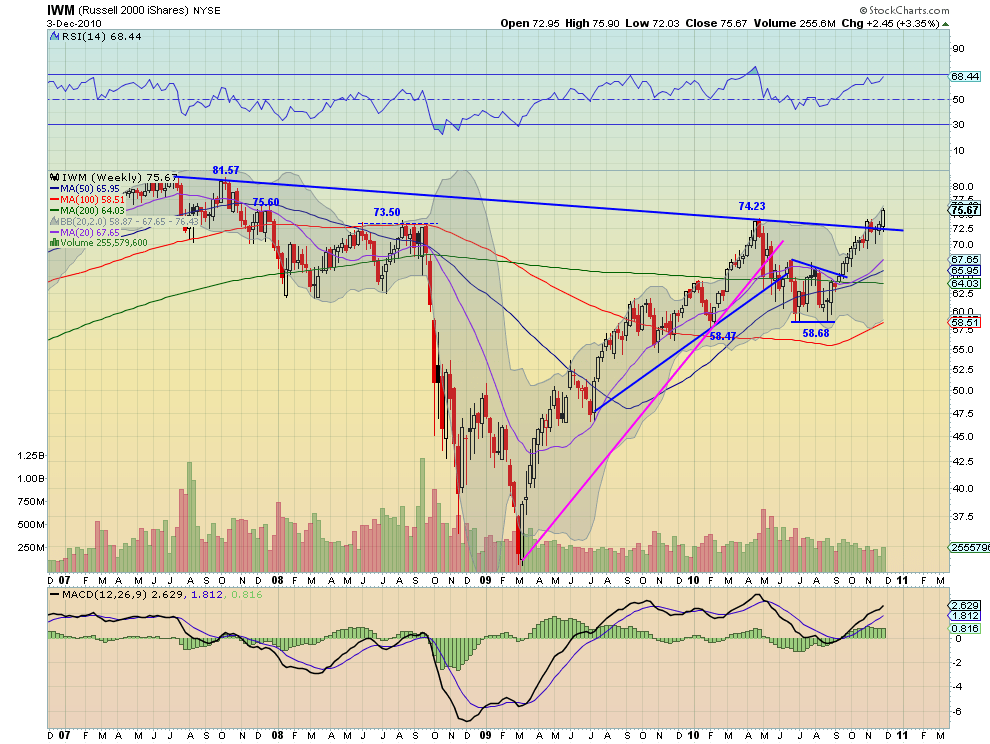
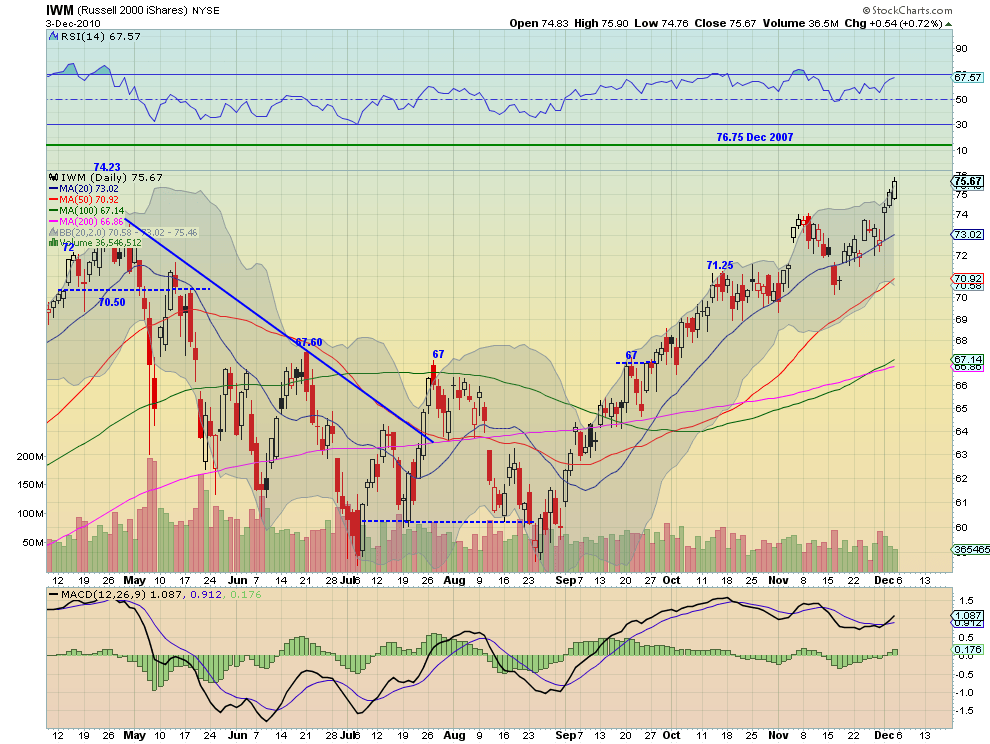
The IWM marched higher off of a test of the rising 20 day SMA on the daily chart after opening gap up at the recent high Wednesday. The MACD and RSI are rising but today’s breach of the top of the Bollinger bands may give it a pause. Otherwise it likes strong. There is support at the previous high from April at 74.23 and recently at 74. The weekly chart shows that IWM broke through a stubborn downtrend line that had tangled it for the last four weeks. The nest resistance comes at 76.75 from December 2007 and then 81.57. Support below the 20 day SMA comes at 70.92 to 71.25.
QQQQ Daily
QQQQ Weekly
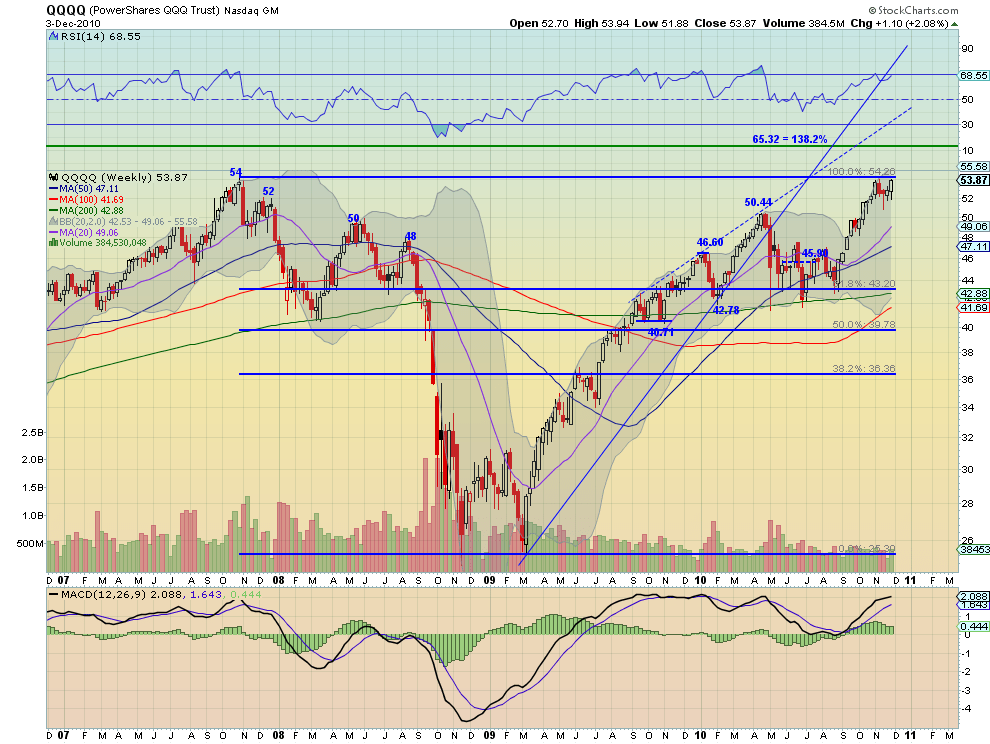
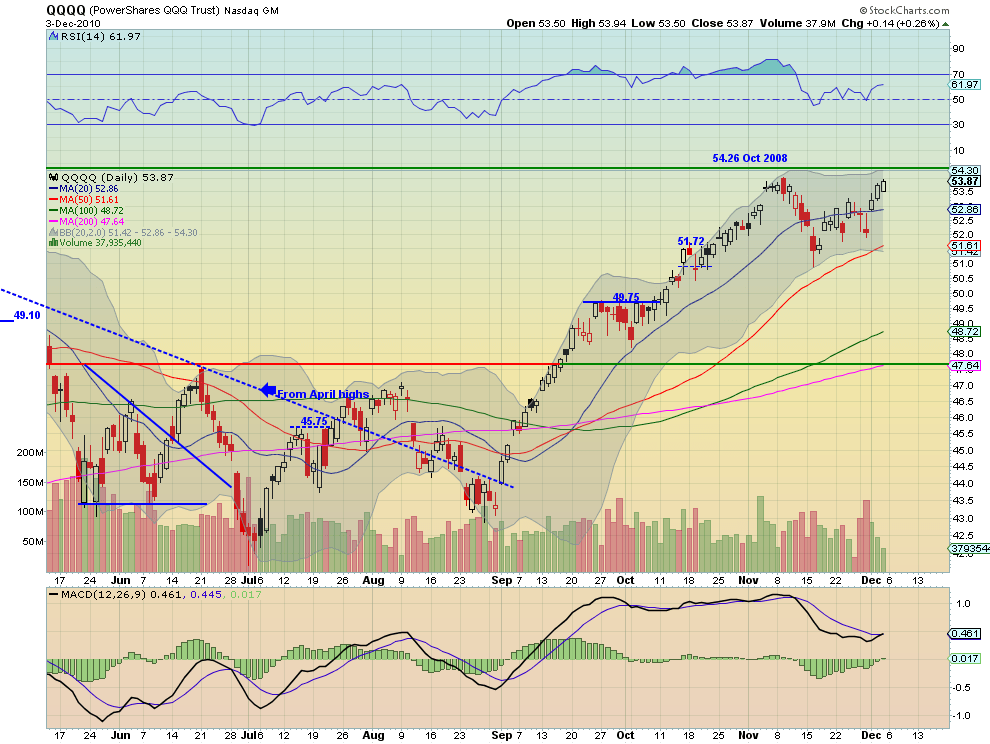
The QQQQ also had a good week ending with Three Advancing White Soldiers pattern launching off of the 20 day SMA support at 52.86. Resistance higher comes at 54.26 from October 2008, a 100% retracement of the move down to the March 2009 lows. Above this the QQQQ is in territory uncharted since 2001. The MACD and RSI are both rising on the daily chart supporting a further move higher. The weekly chart is showing signs of consolidation with price leveling the last 5 weeks. The RSI is rising but near 70 and the MACD is flattened. It can still move higher with these indicators and with all of the weekly SMA’s pointing higher it is more likely than not.
So next week expect higher prices for Gold and Crude Oil and further weakness from the US Dollar Index and US Treasuries. The direction of the Volatility Index break out may determine the speed of the next leg up in equities. US and Emerging markets are already moving. The Chinese market may move slightly lower before it can recover if it fails on the weekly chart.
Trade’m well.
If you like what you see above sign up for deeper analysis and trading strategy by using the Get Premium button above. As always you can see details of individual charts and more on my StockTwits page.
The information in this blog post represents my own opinions and does not contain a recommendation for any particular security or investment. I or my affiliates may hold positions or other interests in securities mentioned in the Blog, please see my Disclaimer page for my full disclaimer.
blog comments powered by Disqus
-
 Gregory W. Harmon CMT, CFA, has traded since 1986 and held senior positions including Head of Global Trading, Head of Product Development, Head of Strategy and Director of Equity. (More)
 -
Subscribe to Dragonfly Capital Views
Lifetime Subscription
$4,000.00Sign upAnnual Subscription
$1,000.00Sign upQuarterly Subscription
$350.00Sign up
Recent Posts
- Bull Scan for 10-14-26
- Premium Earnings 10-13-26: Fastenal and Morgan Stanley
- Bull Scan for 10-13-26
- Premium Earnings 10-12-26: Citigroup and Johnson & Johnson
- 4 Trade Ideas Wells Fargo: Bonus Idea
- 5 Trade Ideas for Monday: AbbVie, Airbnb, Affirm, GE Aerospace and Walmart
- Top Trade Ideas for the Week of October 12, 2026: The Rest Premium
- Top Trade Ideas for the Week of October 12, 2026: The Best
- SPY Trends and Influencers October 10, 2026
- Macro Week in Review/Preview October 9, 2026
Archives