From the Charts: Macro Week in Review Preview November 26, 2010
- Posted by Greg Harmon
- on November 26th, 2010
In last week’s review of the macro market indicators it looked brighter for Gold. US Treasury Bonds looked to have limited further upside as did the US Dollar Index with its Simple Moving Averages (SMA’s) clustering near 80. Crude Oil looked to be in a funk, undecided but better to the upside as long as it holds 81. Equities, including emerging markets looked ready to move higher, trying to pass and gain some distance from the 20 SMA’s. Overhead resistance and the previous week’s test lower suggested a cautious but positive stance.
The week started out in neutral for everything but Gold, which gained on global news. The makings of a potentially quiet holiday shortened week. But then the Koreans ramped things up a bit Monday overnight. Gold, US Treasury Bonds and the US Dollar Index reacted as you would expect, all improving Tuesday at the expense of global equities. By Wednesday morning apparently everyone forgot about Ireland and Korea and equities were right back where they were on Monday, but with the metal’s complex sticking higher and Crude Oil moving up. The week ended on a holiday shortened day with prices lower for equities, Gold and Crude Oil but better on the US Dollar Index and US Treasury Bonds. What should you expect for next week? Let’s look at the charts.
(As always you can see these individual charts and more on my twitter feed and on chartly.)
Gold Daily
Gold Weekly

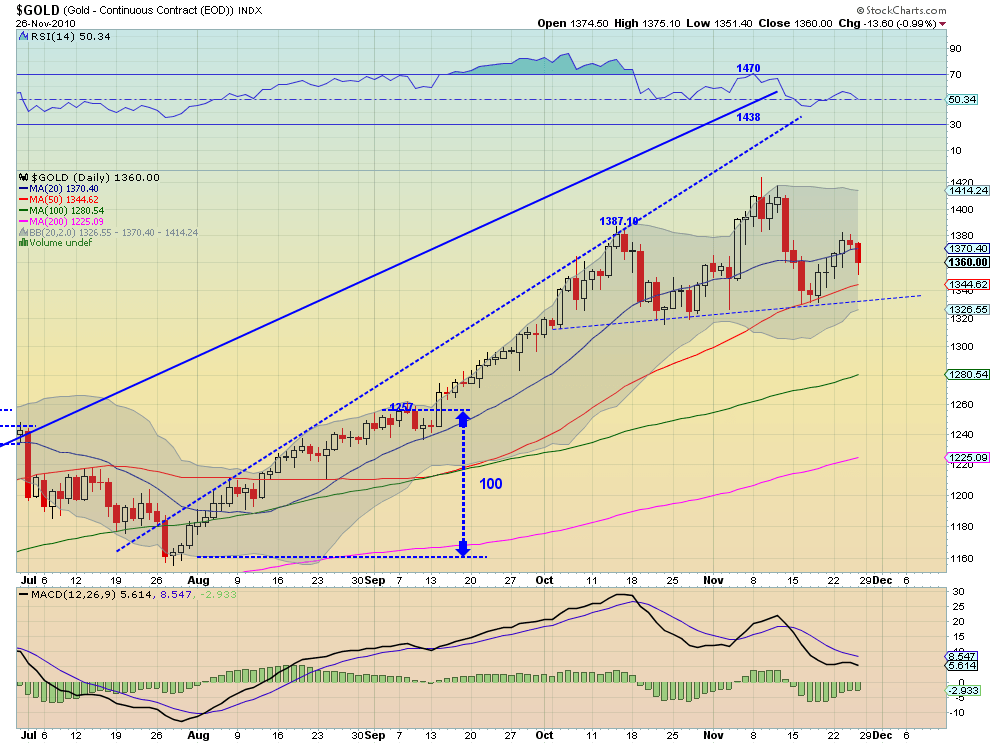
As stated above, Gold had an up and down week, ending very close to unchanged after touching above 1382 and a low just under 1349. On the weekly chart it was a consolidation, an inside candle, just below the support/resistance line in the rising channel. It continues to be high in the Bollinger bands and have a high Relative Strength Index (RSI). There is resistance at 1370 on both charts which may cause it to rest for a while. The daily chart shows resistance above the 1370 level at 1387.10 and then 1392 higher with support at 1344.62. The RSI on the daily chart is hovering in the mid 50’d after bouncing just under 50 a little over a week ago. The Moving Average Convergence Divergence (MACD) indicator is improving on the daily chart which is a positive sign for the future,but it need to get back above and stay over the 20 day Simple Moving Average (SMA) for any strong price movement to the upside. Some signs of consolidation or short term weakness in the long uptrend, might be time to tighten stops or buy some protection.
West Texas Intermediate Crude Daily

West Texas Intermediate Crude Weekly

From the weekly chart Crude Oil continues to hold the break out above the at 81, which remains support, even after testing outside of the top Bollinger band two weeks ago. That the SMA’s below have not come into play is a good sign for future prices. RSI and MACD on the weekly chart are still holding steady near the neutral area, waiting for a catalyst. The daily chart shows a strong move higher on Wednesday to the 20day SMA and holding most of that move Friday. Resistance can be found higher at 86 and then 87. RSI and MACD for Crude Oil on the daily chart show a bottoming and initial rise, if continued, bode well for higher prices. Crude continues to look higher as long as it holds 81.
US Dollar Index Daily

US Dollar Index Weekly

The weekly chart on the US Dollar Index shows a strong continuation higher. It is now near resistance of the 50 and 100 week SMA’s after bouncing off of the neckline of the large Had and Shoulders formation 3 weeks ago. Above the SMA’s 82.08 will provide some resistance. The weekly MACD is approaching 50, where in bearish mode, it has rejected before. The daily charts shows a move above the 100 day SMA at 80.21 which is now support and finishing after touching the 61.8% retracement of the last down move near 80.54. It is now breaking the top Bollinger band and may rest or pullback. The RSI is rolling and the MACD declining, which would support some weakness in the short term.
iShares Barclays 20+ Yr Treasury Bond Fund Daily
iShares Barclays 20+ Yr Treasury Bond Fund Weekly

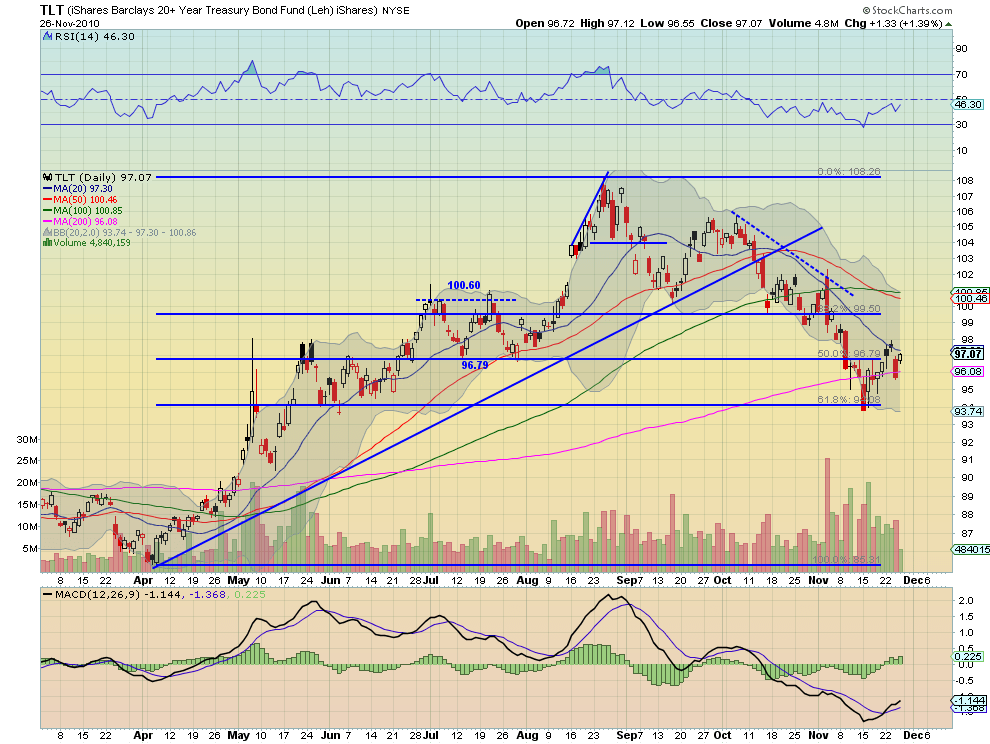
The weekly chart for US Treasury Bonds, represented by TLT, bounced off of the 50 and 100 week SMA’s last week but could not retake the 97.96 resistance area. Additionally the weekly MACD is still weak and the RSI could not retake the 50 level. Moving to the daily chart Bonds were able to hold support at the 50 day SMA but could not retake the falling 20 day SMA above at 97.30. Should it get higher there is resistance at 99 above. Major support is at 94.08 below. Continued weakness in the RSI and inability to break through 50, as it was during the major up move, and a flattening MACD suggest it may be nearing a top.
iShares MSCI Emerging Markets Index Daily
iShares MSCI Emerging Markets Index Weekly
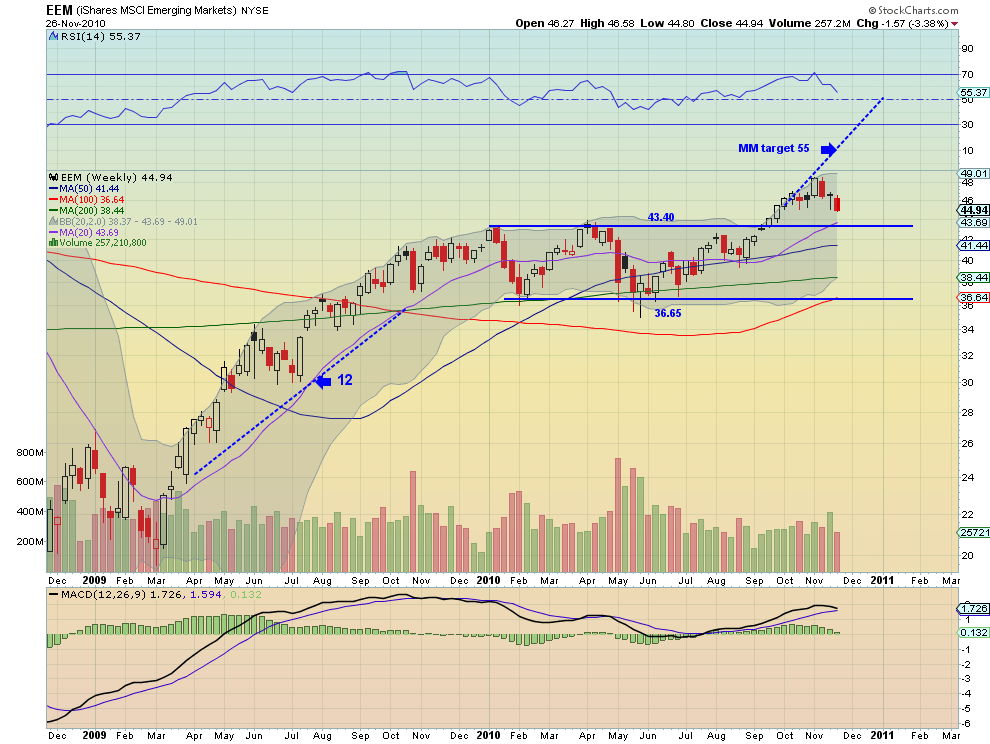
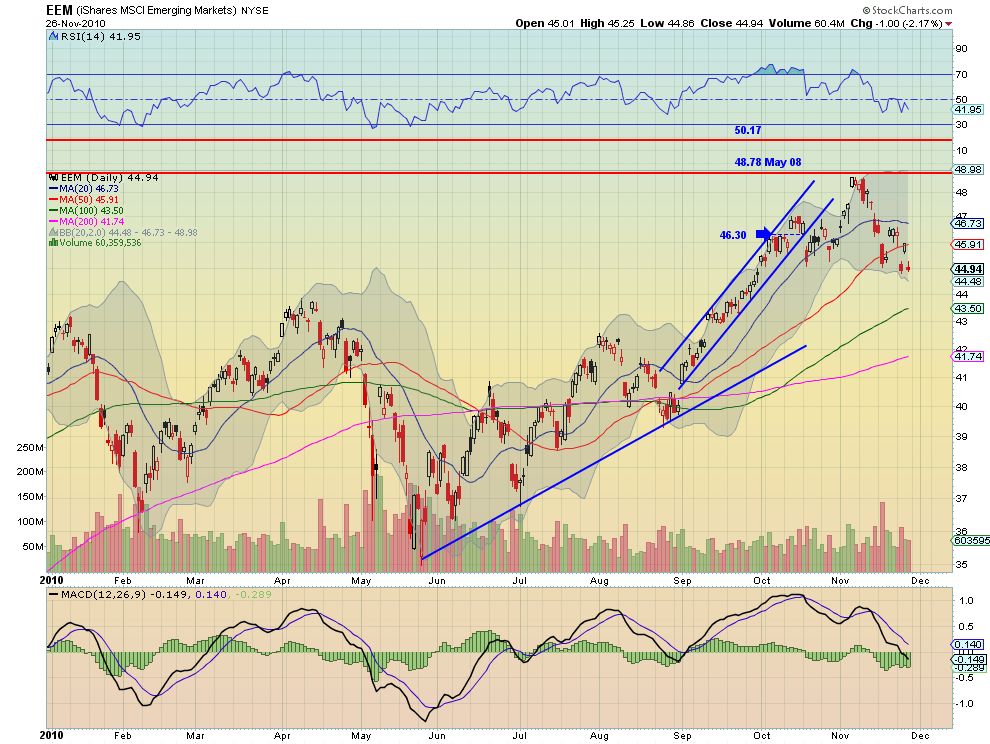
Emerging markets, as followed by the EEM, finished a bad week right on support of a gap from late September at 44.90. There is clear air underneath that level to 43.80 and then support at 43.40 from the weekly chart. On the daily chart the MACD looks weak and the RSI could not sustain above 50 also looking weak. Resistance in the short term is at 45.91 from the 50 day SMA and then 46.30 above that. The weekly chart is also weak with a falling RSI and declining MACD indicator. It looks to test the 43.40 break out area.
VIX Daily

VIX Weekly
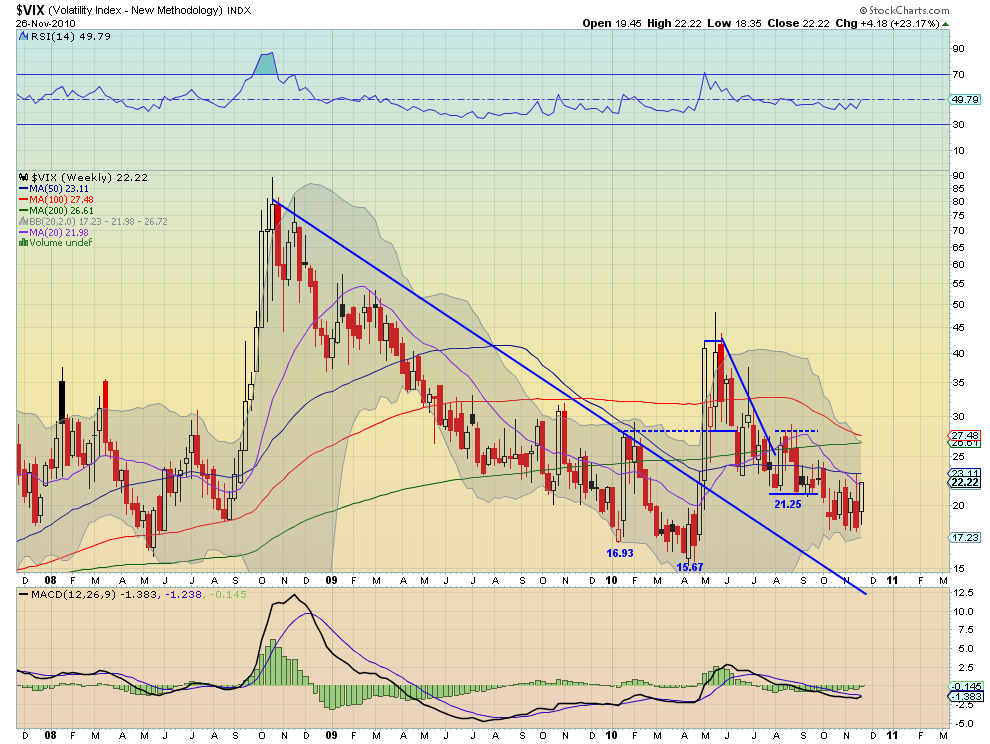
The Volatility Index pierced the 21.25 resistance area closing at 22.22 for the week. It still needs to get through 24 and then 26.60 to 27.50 area to show a major change. The 100 day SMA at 22.39 will also provide upside resistance. The rising RSI and MACD on the daily chart suggest that volatility may now be moving up.
SPY 60 minute
SPY Daily
SPY Weekly

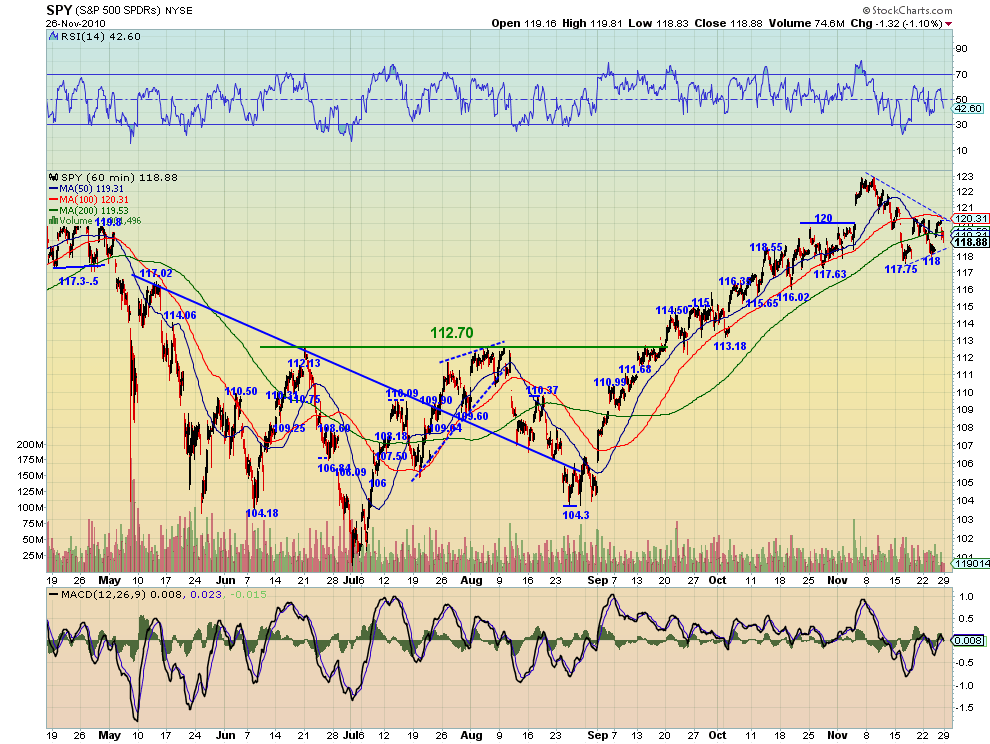
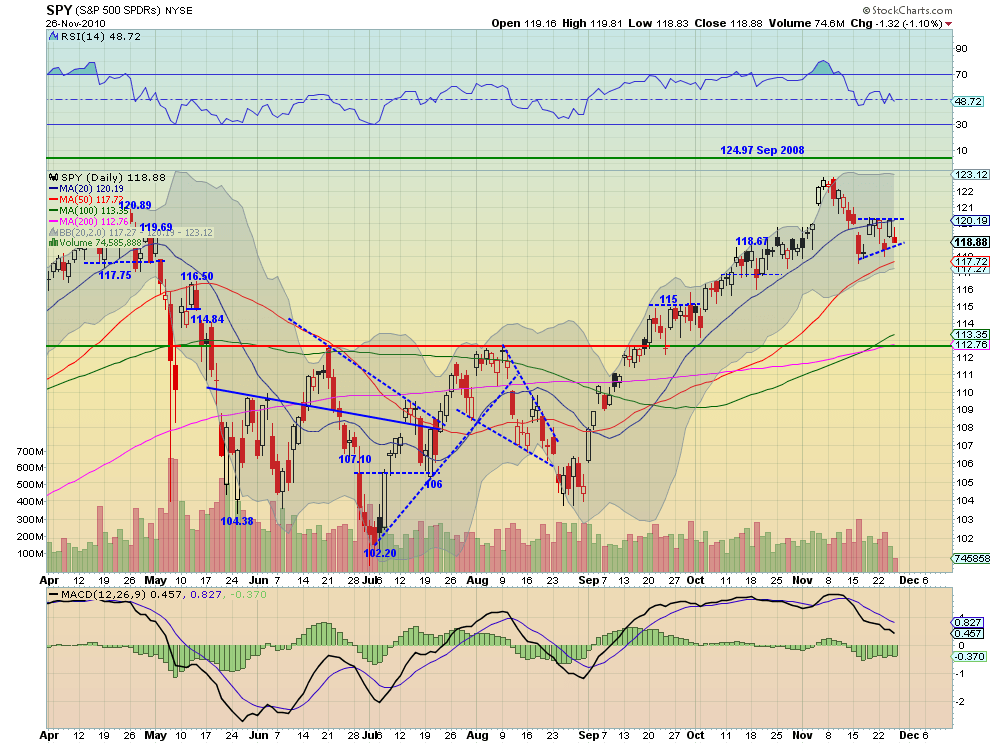
The SPY hourly chart shows a tightening of the high to low range, a topping of the hourly SMA’s and perhaps a symmetrical triangle over the last 3 weeks. The daily chart looks like it could still be either an ascending triangle or a bear flag. How is that for indecisiveness. Either way 120.19-.20 has been resistance and above that it sees further resistance at 120.89 on the daily chart followed by 123. It is very near support on the downside at 118.75 and 117.72-.75 below. The MACD and RSI on the daily chart are indecisive as well flat lining. The weekly charts shows a continued search for support since the RSI bounced off of 70. It printed an inside candle this week with support at 118 and 114.15 lower. It could go either way in the short run but looks like it may be lower with the weight of the weekly chart.
IWM Daily
IWM Weekly

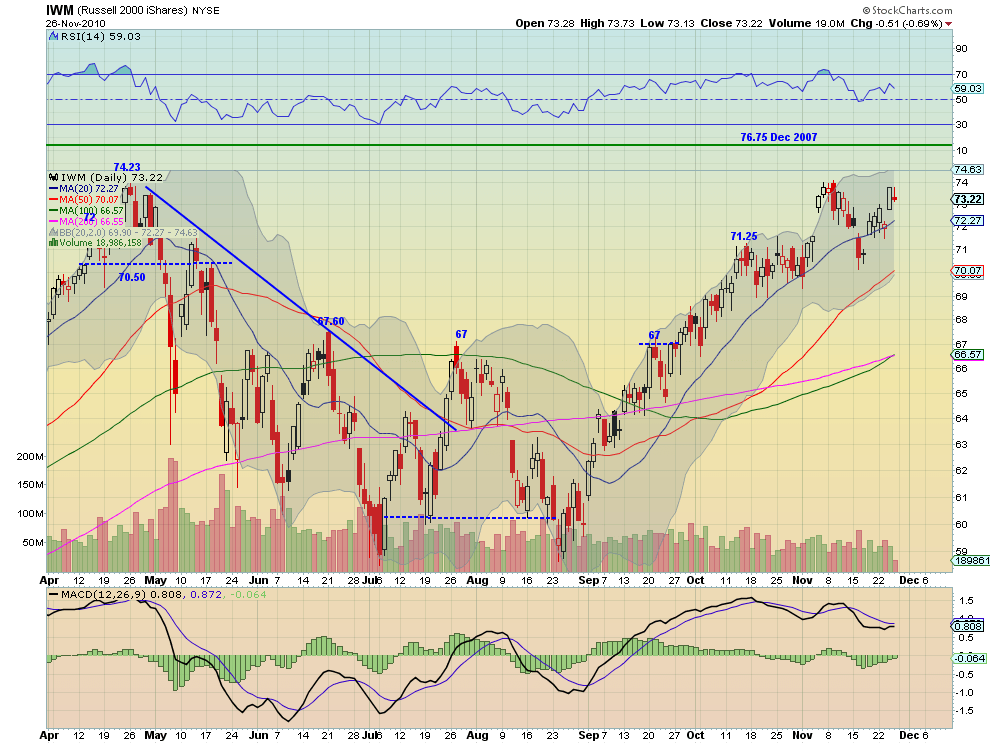
Th weekly chart for IWM continues to hold right on the descending trendline for the fourth week in a row. MACD and RSI are in the positive zone but are getting flat. On the positive side 3 of the 4 SMA’s tracked on the weekly chart are pointing higher. Moving to the daily chart, IWM bounced a bit above the 20 day SMA at 72.27 that it has been riding and above 72.75, now support. The MACD is improving and the RSI is strong. It looks better to the upside than the SPY. There is resistance at 74 and then 74.23 higher.
QQQQ Daily
QQQQ Weekly
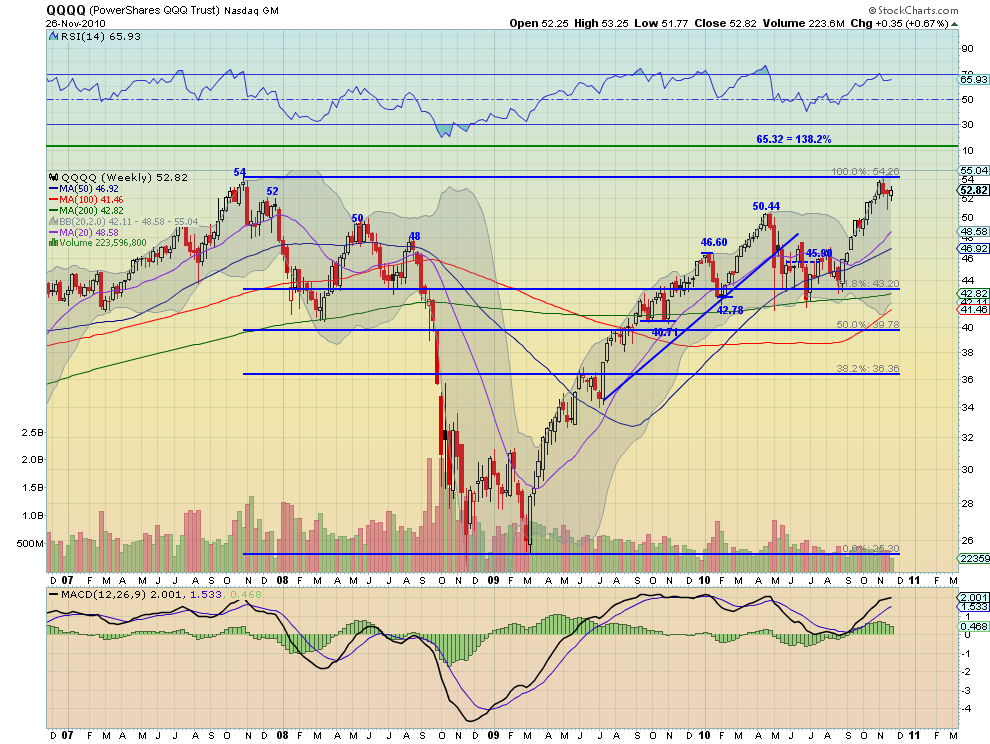
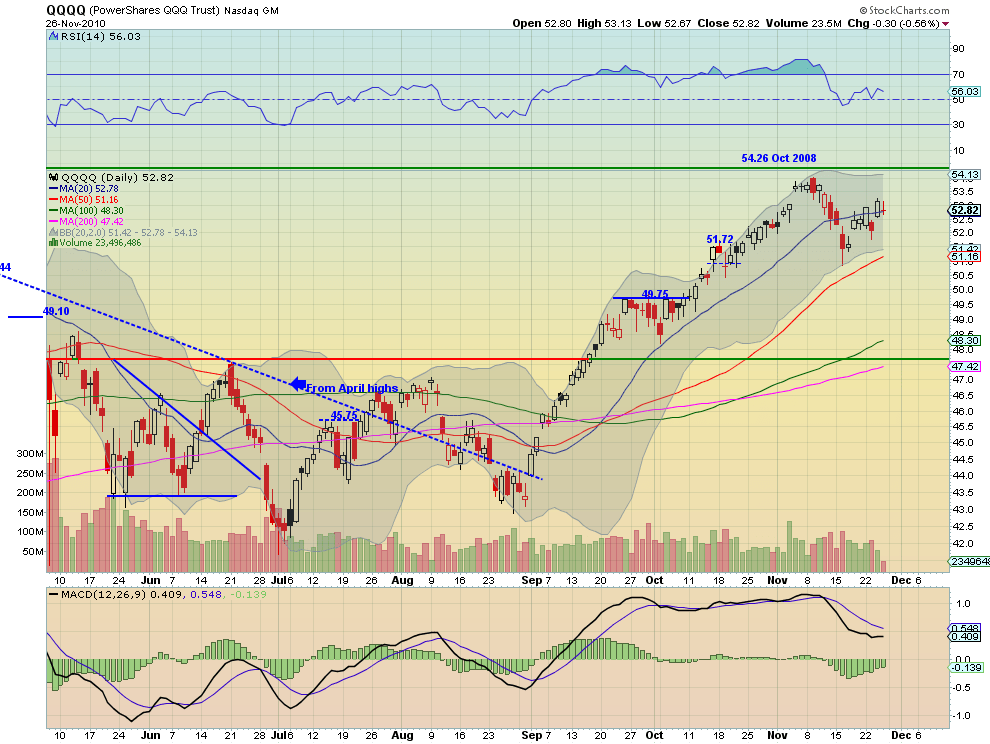
The QQQQ has been holding strong after testing the 2007 highs at 54.26 recently. The weekly chart shows the SMA’s heading higher but the RSI and MACD stalling and falling slightly. Moving to the daily chart there is a short term rising trend with improving MACD and strong RSI. It is sitting right above 52.78, the 20 day SMA as support with 52 support lower. 52 is the key to moving up further. Resistance can be found higher at 53 and 53.50 before testing the highs again.
So next week looks to bring caution to the markets again. Gold may rest or pullback some more in the long term uptrend, the US Dollar Index and US Treasuries look higher but may be topping at resistance shortly and Oil seems primed to move higher. Emerging markets look in trouble and headed lower. The bias in the Volatility Index is to the upside and combined with the potential for a stronger dollar the SPY, although undecided, is biased lower short term. IWM and QQQQ however seems stronger and biased to the upside short term.
Good luck next week and trade’m well.
If you like what you see above sign up for deeper analysis and trading strategy by using the Get Premium button above. As always you can see details of individual charts and more on my StockTwits page.
The information in this blog post represents my own opinions and does not contain a recommendation for any particular security or investment. I or my affiliates may hold positions or other interests in securities mentioned in the Blog, please see my Disclaimer page for my full disclaimer.
blog comments powered by Disqus
-
 Gregory W. Harmon CMT, CFA, has traded since 1986 and held senior positions including Head of Global Trading, Head of Product Development, Head of Strategy and Director of Equity. (More)
 -
Subscribe to Dragonfly Capital Views
Lifetime Subscription
$4,000.00Sign upAnnual Subscription
$1,000.00Sign upQuarterly Subscription
$350.00Sign up
Recent Posts
- Bull Scan for 10-14-26
- Premium Earnings 10-13-26: Fastenal and Morgan Stanley
- Bull Scan for 10-13-26
- Premium Earnings 10-12-26: Citigroup and Johnson & Johnson
- 4 Trade Ideas Wells Fargo: Bonus Idea
- 5 Trade Ideas for Monday: AbbVie, Airbnb, Affirm, GE Aerospace and Walmart
- Top Trade Ideas for the Week of October 12, 2026: The Rest Premium
- Top Trade Ideas for the Week of October 12, 2026: The Best
- SPY Trends and Influencers October 10, 2026
- Macro Week in Review/Preview October 9, 2026
Archives