Top Ten Trade Ideas for the Week of November 15, 2010
- Posted by Greg Harmon
- on November 14th, 2010
After looking at over 500 charts and posting my thoughts on many of them, I have found some good setups for the week. This week’s list contains 5 long ideas and 6 plays that could go either way. These were selected and should be viewed in the context of the broad market daily and weekly trend, reviewed Friday, which looks like the short term damage in Gold and Crude Oil may continue, within the long term upward moves. The US Dollar Index can prove that is is reversing and strengthening if it continues higher. US Treasury Bonds appear weak and headed lower in price. Emerging Market and US equities may also see short term continued downward pressure, but it appears to be limited when looking at the longer term trend and time-frames. It is this short term uncertainty that creates all the two way opportunities. Remember also that sector analysis showed that the strongest sectors right now are Materials, Energy and Consumer Discretionary.
(As always you can see these individual charts and more on my twitter feed and on chartly.)
Here are the top ten for the week in alphabetical order:
1. Balantyne Strong, Ticker: BTN
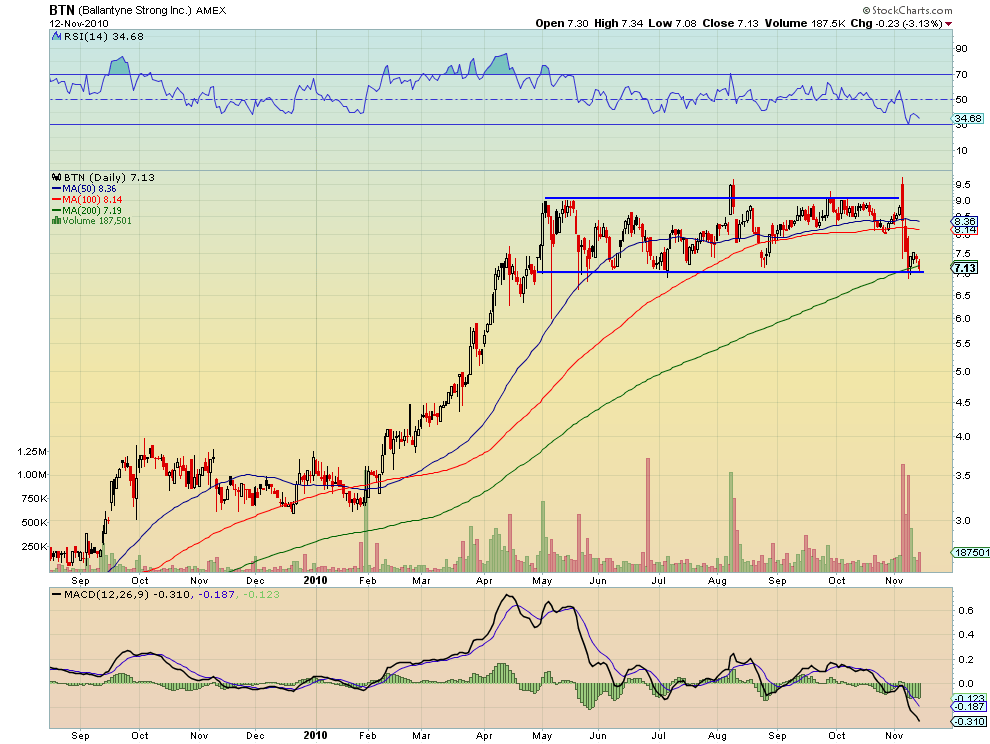
Balantyne Strong has been smacked down to to support at 7 recently. If it holds 7 and can get over the 200 day Simple Moving Average (SMA) at 7.19 then it can run towards the top of the channel with resistance found first at 7.50 followed by 8.14 and 8.36. If it fails at 7 then a short down to 6.50 seems safe. The Relative Strength Index (RSI) has bounced at 30 once and is near there now, and the Moving Average Convergence Divergence (MACD) indicator is flattening, so be ready for either scenario.
2. CIT Group, Ticker: CIT

CIT Group had a rough week after falling out of a descending triangle/wedge. Friday’s bullish Hammer makes it interesting though. Using support lower at 40.87 as a stop can try long and look for resistance at 43 and then 44.
3. Callon Petroleum, Ticker: CPE

Callon Petroleum is in a bullish flag after rising from the 5.20 level. There is support in the flag at 5.60. If it can get above 5.80, the top of the flag, then it can run to resistance at 6.60 and then 7.25.
4. Express Scripts, Ticker: ESRX

Express Scripts is also in a Bullflag, with support at the 52.2-.60 area. If it loses that support there is support lower at 49. A break out of the flag higher above 53.33 can run, with a measured move target of 57.
5. Huntington Bancshares, Ticker: HBAN
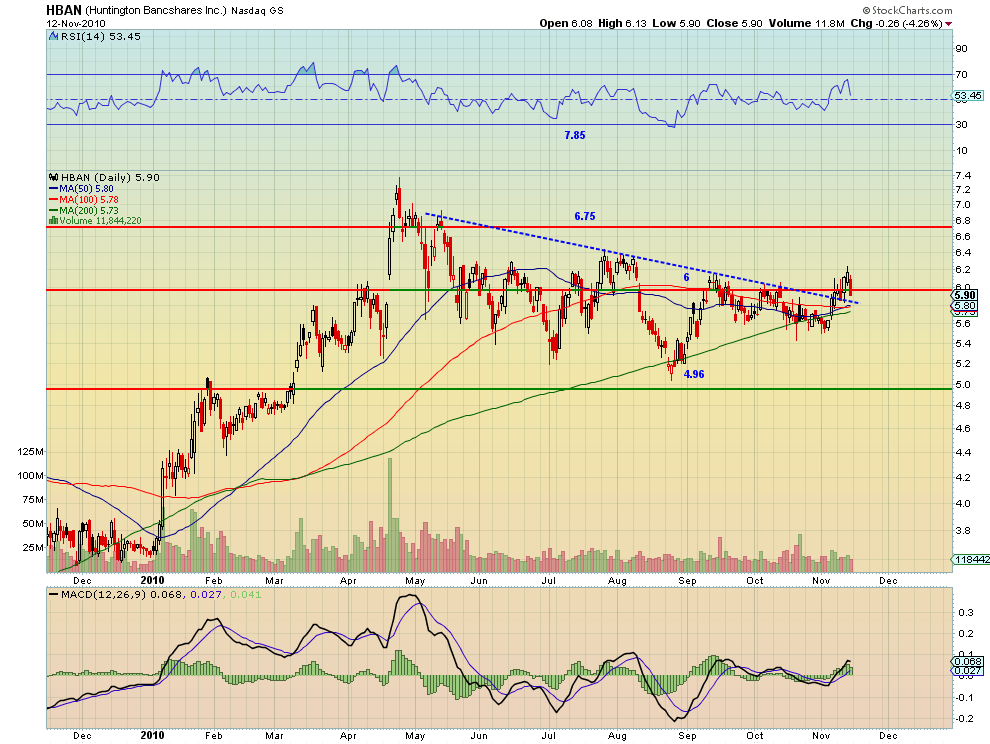
Huntington Bancshares is retesting the breakout of the long symmetrical triangle near 5.80. If that level holds it can move higher to try 6 followed by 6.20 and 6.40. The SMA’s are tightly bound near there and should give good support.
6. Ivanhoe Mines, Ticker: IVN

Ivanhoe Mines printed a bullish hammer Friday that tested the support area 24.00-24.50. If it is confirmed then 26 is the nest resistance level followed by 27. Through 27 there is open air for a run higher.
7. Massey Energy, Ticker: MEE

Massey Energy has been consolidating in an ascending triangle the last week. Several candles have probed the 48 resistance level with higher lows along the way. This stock wants higher. Through 48 the first target is 52.
8. National Presto Industries, Ticker: NPK
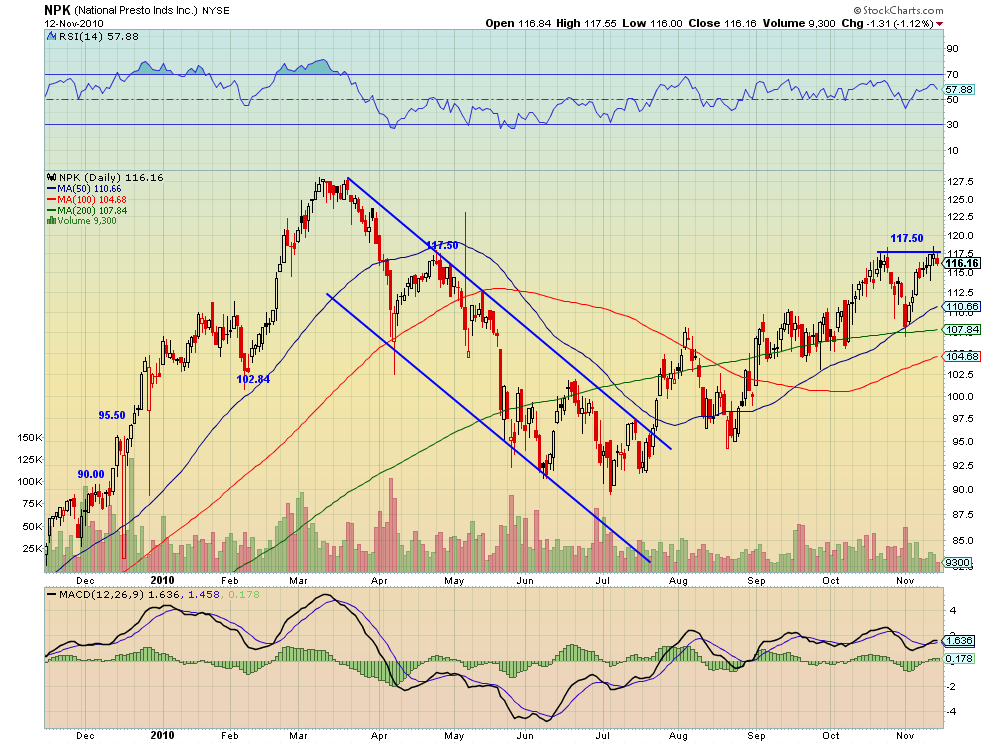
National Presto has been trying to raise the roof at 117.50. If it can get through it then the first resistance can be found at 125.50 and then the March highs at 128. Below support at 115 it can fall to 110.66
9. MetroPCS Communications, Ticker: PCS

MetroPCS is also in a Bullflag with support at 12. If it falls out of the flag then the next support level is at 11.15 lower. If it can break the flag higher above 12.25 then a measured move would target 13.50. Be prepared to play either way.
10. Questcor Pharmaceuticals, Ticker: QCOR

Questcor is in a Bullflag as well with support at 12.50. If it falls out of the flag then there is support at 11.50. If it can break the flag higher above 13.25 then a measured move target is 15.25.
Bonus Idea: Boston Beer Co., Ticker: SAM
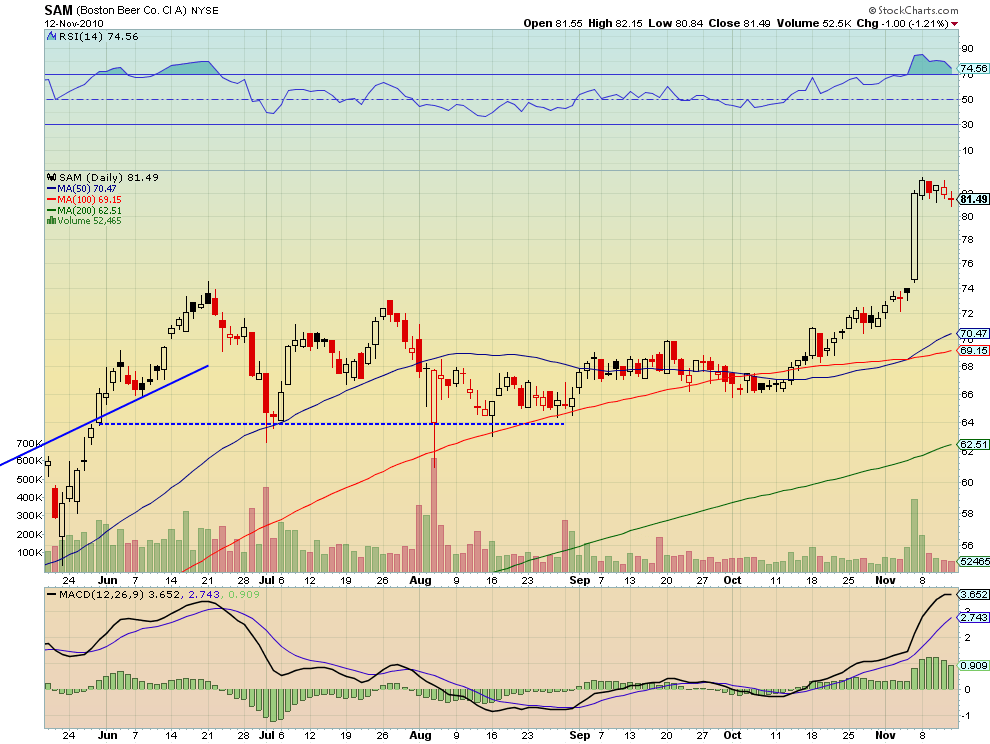
Sam Adams Christmas Ale it out so grab one while admiring the the bull flag. If it can hold support of the flag at 81 and then break out above 83.5, the measured move target is 92. If it falls out of the flag then there is clear air down to 74. Massive either way.
Trade’m well!
If you like what you see above sign up for deeper analysis and trading strategy by using the Get Premium button above. As always you can see details of individual charts and more on my StockTwits page.
The information in this blog post represents my own opinions and does not contain a recommendation for any particular security or investment. I or my affiliates may hold positions or other interests in securities mentioned in the Blog, please see my Disclaimer page for my full disclaimer.
blog comments powered by Disqus
-
 Gregory W. Harmon CMT, CFA, has traded since 1986 and held senior positions including Head of Global Trading, Head of Product Development, Head of Strategy and Director of Equity. (More)
 -
Subscribe to Dragonfly Capital Views
Lifetime Subscription
$4,000.00Sign upAnnual Subscription
$1,000.00Sign upQuarterly Subscription
$350.00Sign up
Recent Posts
- Bull Scan for 10-14-26
- Premium Earnings 10-13-26: Fastenal and Morgan Stanley
- Bull Scan for 10-13-26
- Premium Earnings 10-12-26: Citigroup and Johnson & Johnson
- 4 Trade Ideas Wells Fargo: Bonus Idea
- 5 Trade Ideas for Monday: AbbVie, Airbnb, Affirm, GE Aerospace and Walmart
- Top Trade Ideas for the Week of October 12, 2026: The Rest Premium
- Top Trade Ideas for the Week of October 12, 2026: The Best
- SPY Trends and Influencers October 10, 2026
- Macro Week in Review/Preview October 9, 2026
Archives