From the Charts: Macro Week in Review/Preview November 20,2010
- Posted by Greg Harmon
- on November 20th, 2010
Last week’s review of the macro market indicators for the week looked to bring continued short term damage in Gold and Crude Oil, within the long term upward moves. The US dollar Index was poised to prove that is is reversing and strengthening if it could continue higher. US Treasury Bonds appeared weak and headed lower in price. Emerging Market and US equities looked to experience continued downward pressure in the short term, but that it would be limited when looking at the longer term trend and time-frames.
The week started off as anticipated with Gold, Crude and Global equities moving lower. The US Dollar Index started higher and US Treasuries fell further. But by mid-week the corrections had all reversed. Gold, Crude and Global Equities found support and the US Dollar Index reversed lower. US Treasuries also found a floor and finished the week higher. What should you expect and prepare for next week? Let’s look at the charts.
(As always you can see these individual charts and more on my twitter feed and on chartly.)
Gold Daily
Gold Weekly

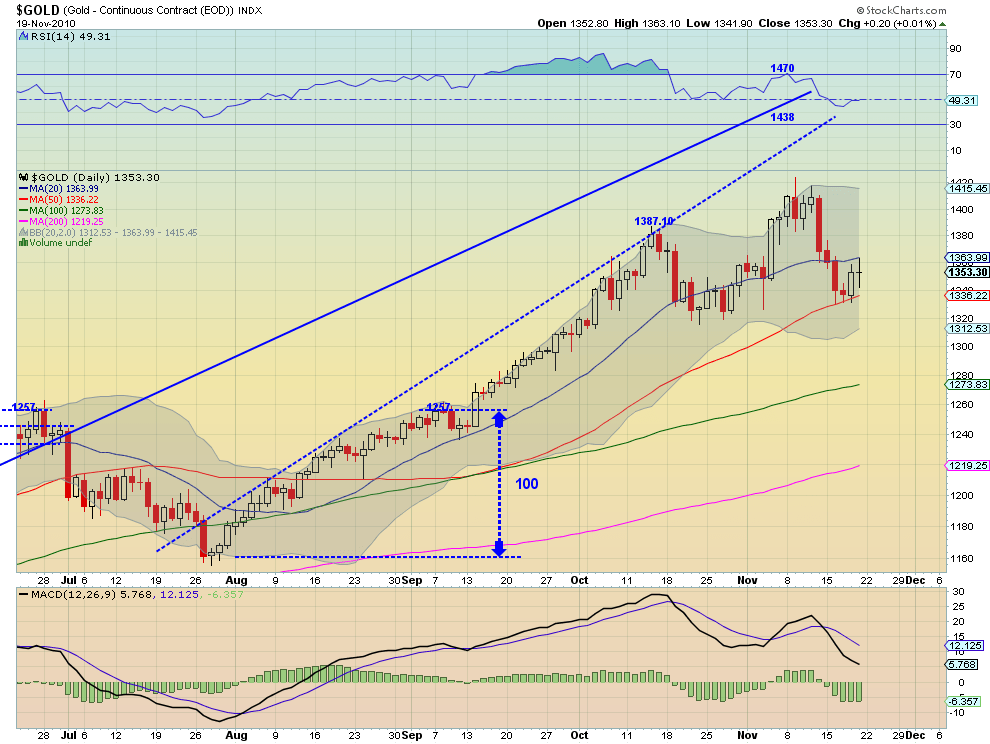
Gold continued it s pullback early in the week but bounced nicely off of the 50 day Simple Moving Average (SMA) and ended the week with a Doji. The Relative Strength Index (RSI) flat near 50 and the Moving Average Convergence Divergence (MACD) indicator also leveling, offer little clue to the next move on the daily chart. Resistance at the 20 day SMA at 1363.99 and support at the 50 day SMA at 1336.22 form the boundaries for now. The rising SMA’s could be read as a sign of future gains, and if that happens resistance will be found at 1370 and 1387.10. If the 50 day SMA fails then 1320 will be the first support. On the weekly chart, There is a range appearing between 1330 and 1370. A break out to the upside would see resistance at the mid-channel line at 1392 and a break of 1330 would see support at 1278. On the weekly chart the SMA’s are all rising as well. Gold looks higher longer term but the jury is still out about whether the short term pullback is over.
West Texas Intermediate Crude Daily
West Texas Intermediate Crude Weekly

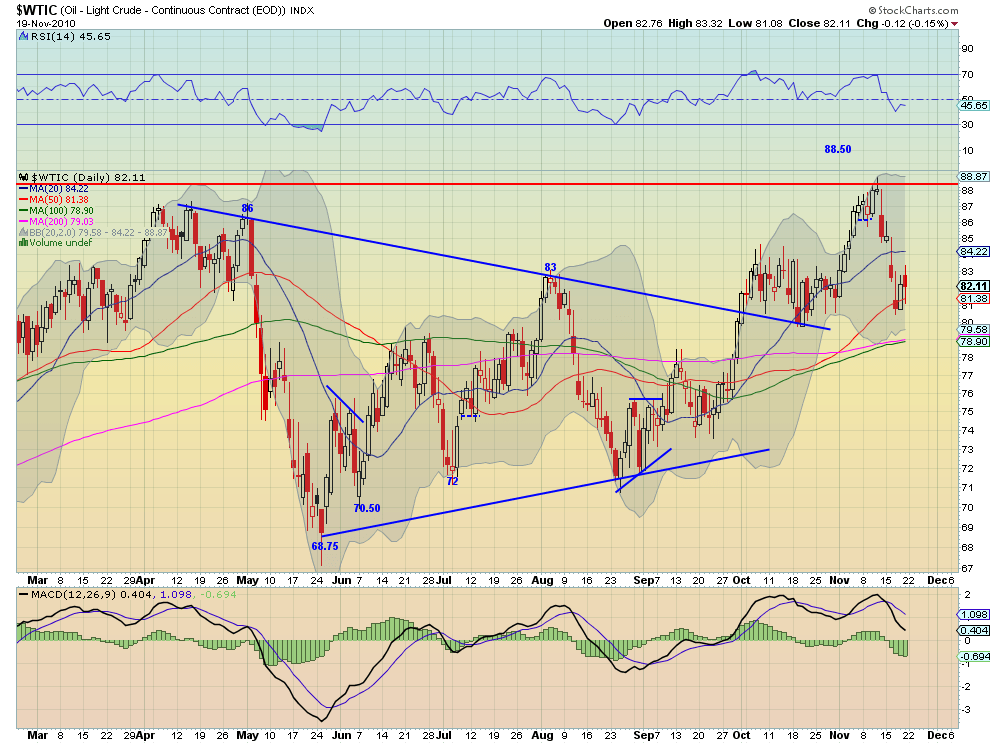
Crude Oil has held well at 81 on the recent pullback. Both the daily and weekly charts show this as a key support level. This is a set of charts that needs to figure out where it wants to go next. The RSI near 50 and MACD flat on the weekly and leveling on the daily do not give a great edge either way. That said there is strong support of the SMA’s on the daily and weekly below 81 at 78.35-79.03. If it can break above 84.00-.22 then there is resistance from the daily chart at 86from the weekly chart at 87.
US Dollar Index Daily

US Dollar Index Weekly

The US Dollar Index touched resistance at the downtrend line at 79.30 on the daily chart and rejected downward this week. It is now headed lower to the rising 20 SMA at 77.63 as support. There are intermediate resistance and support levels of 78 and 79 between as well. The shorter timeframe MACD and RSI support a continued move lower. On the weekly scale the RSI shows a confirmation of the bounce off of the 30 support area and a waning MACD. The Shooting Star, printed on the weekly, could be ignored if the daily chart was not already moving lower. Any further rise looks to be stymied at the convergence of the weekly SMA’s between 79.78 and 81.03. A failure to hold at 77.63 could bring the 77 level and then 76.45 neckline on the weekly chart in to play.
iShares Barclays 20+ Yr Treasury Bond Fund Daily
iShares Barclays 20+ Yr Treasury Bond Fund Weekly

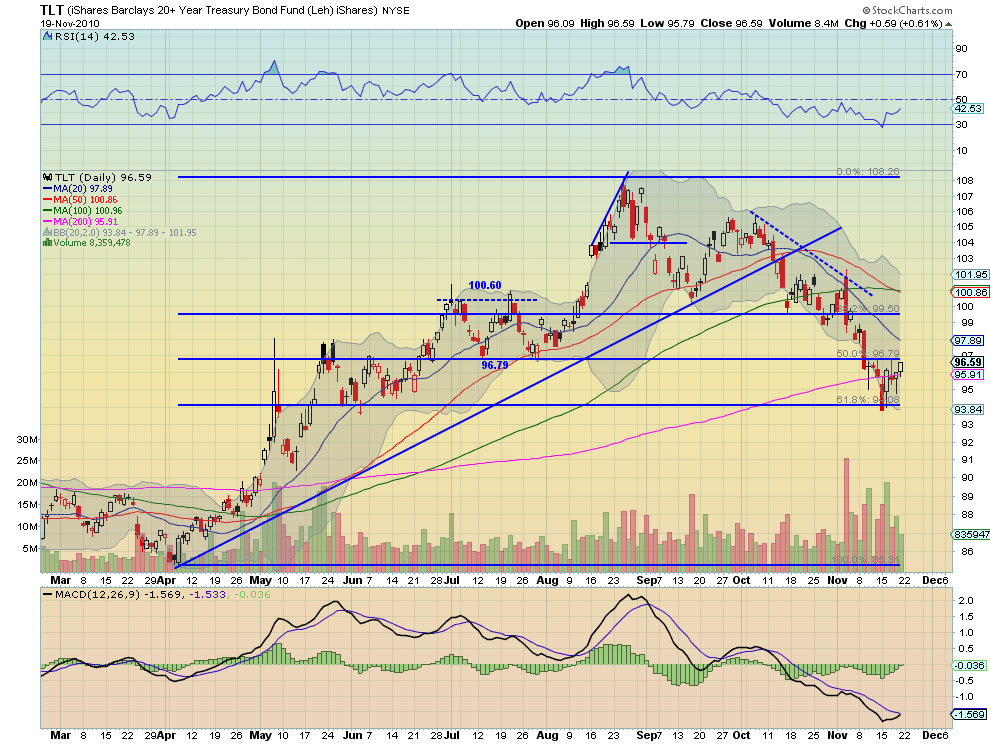
The US Treasury Bond ETF, TLT tested the 61.8% retracement of the April to September up move at 94.08 and eventually held this week. It is now back above the 200SMA on the daily chart, as support at 95.91 and rising to to test resistance at 96.79, the 50% retracement level. The bullish hammer on the weekly chart, which touched and held the 20 and 50 week SMA’s, suggests that it may test the 97.69 resistance on the weekly chart or 97.89 on the daily chart. The falling SMA’s suggest this rise may be short lived.
iShares MSCI Emerging Markets Index Daily

iShares MSCI Emerging Markets Index Weekly
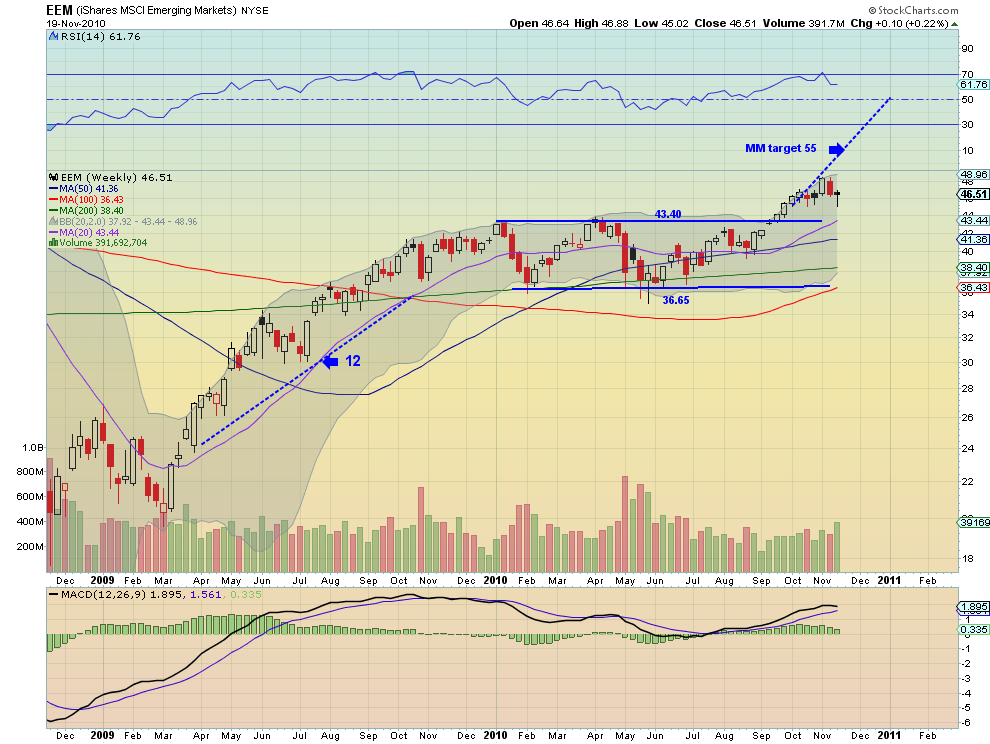
On the daily chart the EEM, Emerging Market ETF, caught a bid at the 50 day SMA this week. The SMA’s are flattening, so short term upside may be limited, but if it can hold 46.30 support and get above 46.86 then there is resistance at 47 and then 47.50. The recent rise in RSI and waning MACD on the daily chart support further upside. The weekly chart shows some consolidation after the break out at 46 but if it can get through 49.60 then the breakout target will be 55. There is still the possibility on the weekly chart for a pullback to support at 43.40.
VIX Daily
VIX Weekly
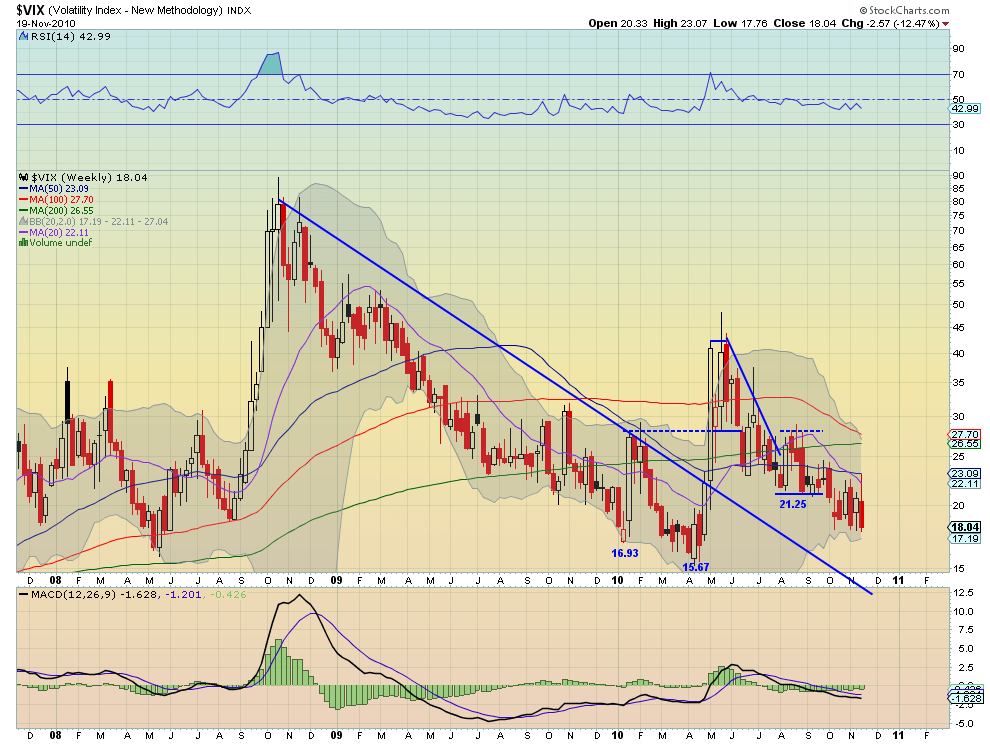
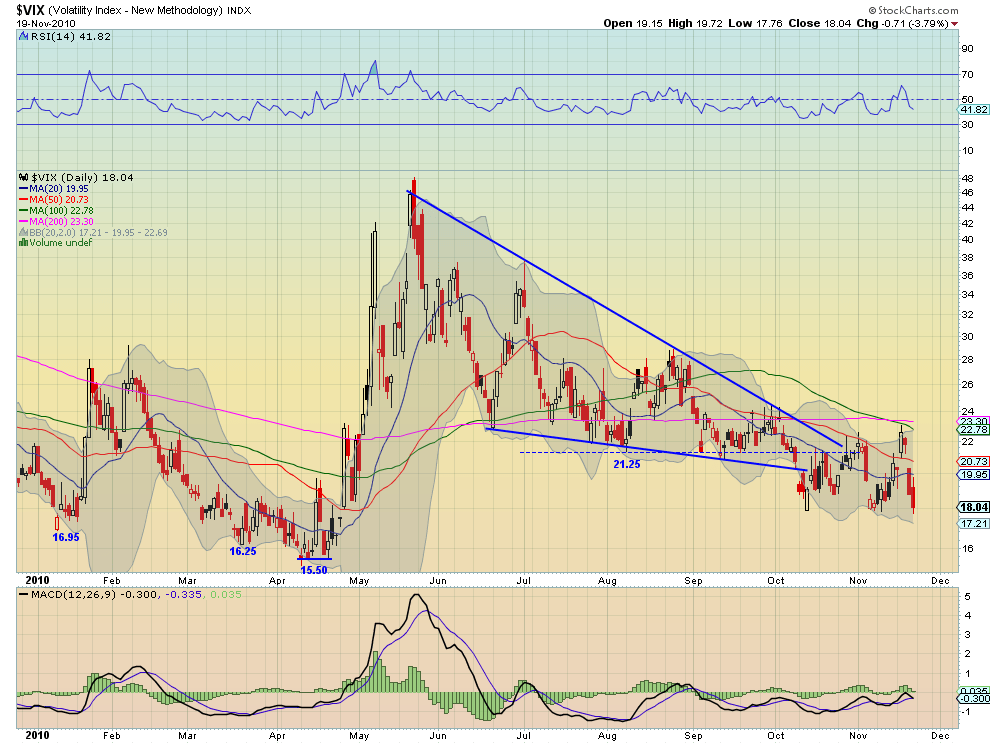
The Volatility Index popped up this week with the early week weakness in the equity markets, but swiftly fell back and is now testing the support area at 18 with further support at 16.95 below. There is resistance at the 19.95-20 area and then 21.25 is strong resistance longer term. Until the VIX breaks out of the 18 to 21.25 range there is not much to see. The weekly chart does show some tightening of the Bollinger bands although the Index is not testing the extremes at this time. Keep glancing at it.
SPY 60 minute
SPY Daily

SPY Weekly
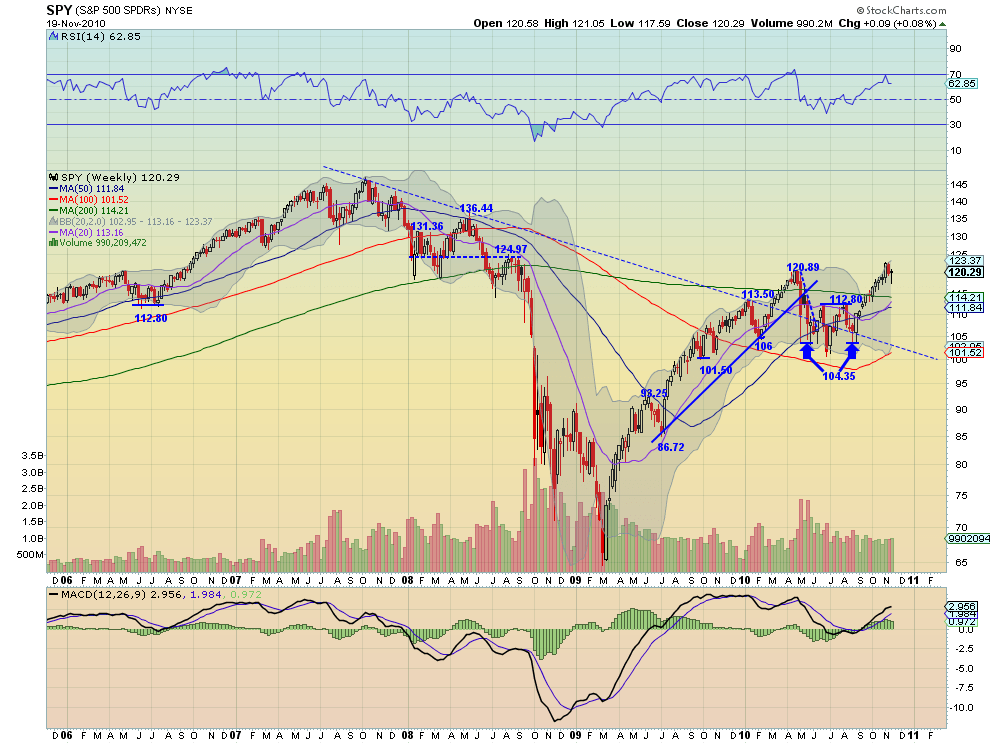
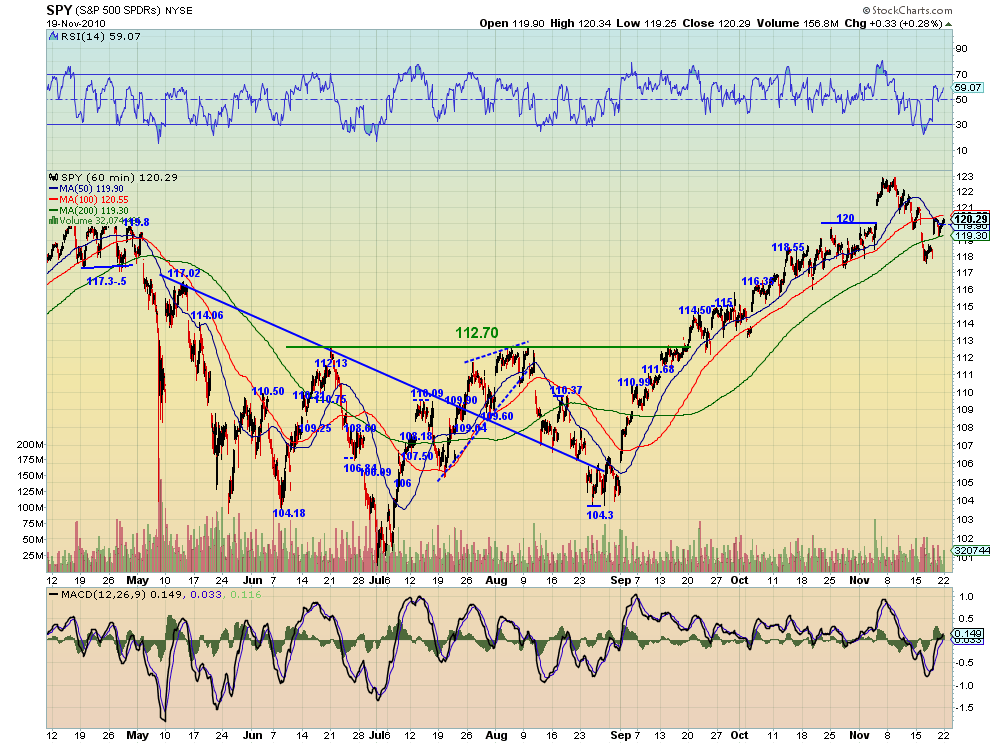
The two gap moves are evident on the 60 minute SPY chart, but what is more telling is the RSI. Both times it touched the 30 line (oversold) it snapped back to 50 quickly. This suggests buyers were waiting for a bargain to buy in. The same gaps are seen on the daily chart. With this chart you can see that the gap up got the SPY back to the 20 SMA and that the RSI did not get much below 50, still in bull territory for an uptrend. Moving to the weekly chart the RSI continues to look strong. The long shadow on the hammer on the weekly chart shows the test lower and reversal, ending the week nearly where it started. The 117.75 to 118.75 consolidation range from October is providing good support below for now. There is resistance at 121 and then 123 from the daily chart before it can move higher. The weekly chart shows the next major high to test will come at 124.97. The SPY is currently still looking better to the upside.
IWM Daily

IWM Weekly
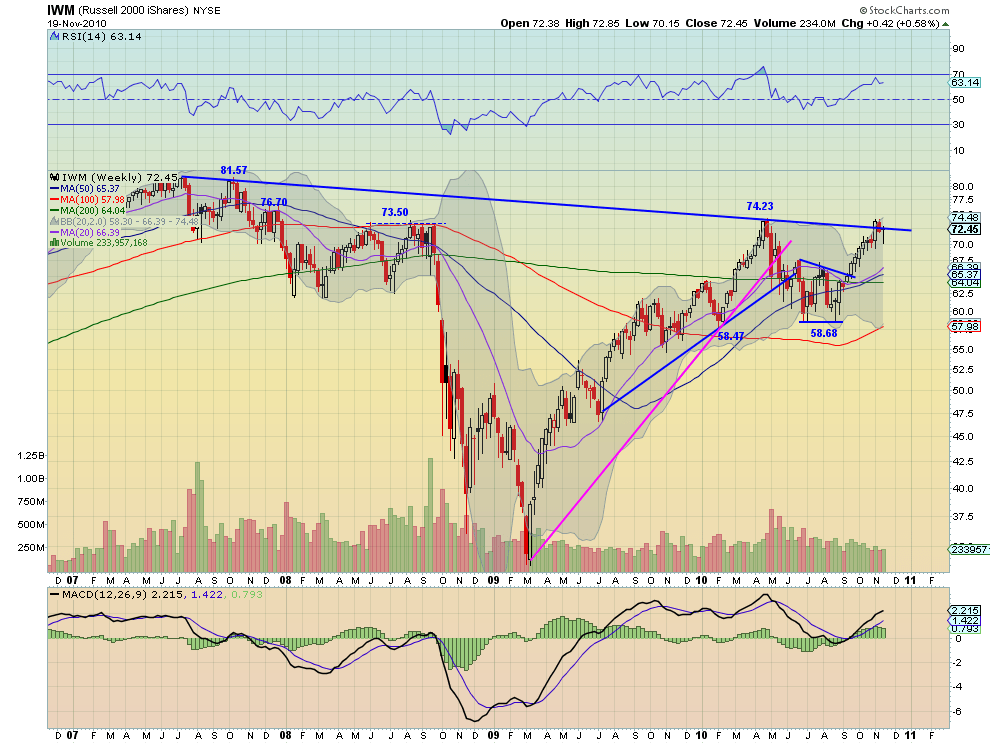
IWM had the same two gaps, down on Tuesday and up on Thursday. The 20SMA played a part in both. It is now above the 20SMA which is acting as support at 71.78 with further support at the October consolidation range between 70.50 and 71.25. Three factors on the daily chart suggest further upside: all the SMA’s are pointing higher, the RSI reversed at 50 and is higher, the MACD is waning. The weekly chart shows a long shadowed candle, practically a doji, right at the longer term downtrend resistance line. The April high of 74.23 remains the next resistance higher if it can get through. The rising SMA’s on the weekly chart suggest that it might.
QQQQ Daily

QQQQ Weekly
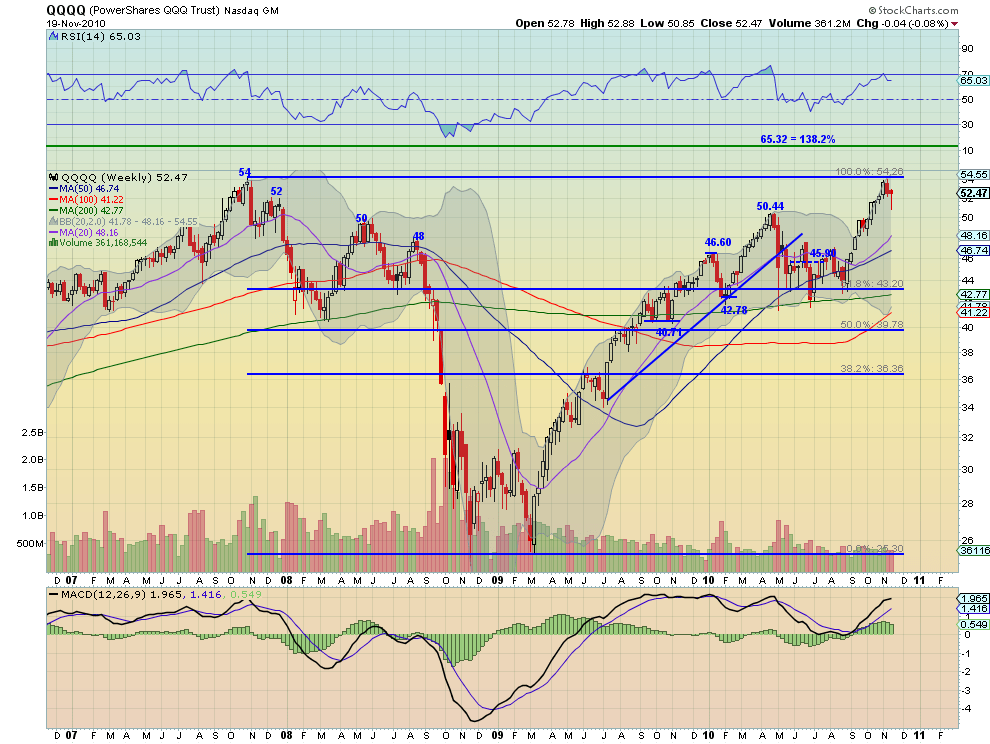
The QQQQ could not quite get back to the 20SMA after its two gap week. Look for it to jump the 20 SMA early next week as a show of strength and a reject a sign of worry. There is resistance higher then at 53 followed by 53.50 higher before the recent high. The long shadow on the weekly chart shows the test lower and reversal this week. Knowing that Friday was an up day is a positive piece of news as well, showing that the test reversed and held above the secondary peak in late 2007 near 52. Losing this level and then 50 would not be good.
So next week looks brighter for Gold and US Treasury Bonds. The US Dollar Index looks to continue the move lower and Crude Oil is undecided but better to the upside as long as it holds 81. Equities, including emerging markets look to move higher, trying to pass and gain some distance from the 20 SMA’s. Overhead resistance and the test lower this past week suggest a cautious but positive stance. Back to the wall of worry.
Trade well.
If you like what you see above sign up for deeper analysis and trading strategy by using the Get Premium button above. As always you can see details of individual charts and more on my StockTwits page.
The information in this blog post represents my own opinions and does not contain a recommendation for any particular security or investment. I or my affiliates may hold positions or other interests in securities mentioned in the Blog, please see my Disclaimer page for my full disclaimer.
blog comments powered by Disqus
-
 Gregory W. Harmon CMT, CFA, has traded since 1986 and held senior positions including Head of Global Trading, Head of Product Development, Head of Strategy and Director of Equity. (More)
 -
Subscribe to Dragonfly Capital Views
Lifetime Subscription
$4,000.00Sign upAnnual Subscription
$1,000.00Sign upQuarterly Subscription
$350.00Sign up
Recent Posts
- Bull Scan for 10-14-26
- Premium Earnings 10-13-26: Fastenal and Morgan Stanley
- Bull Scan for 10-13-26
- Premium Earnings 10-12-26: Citigroup and Johnson & Johnson
- 4 Trade Ideas Wells Fargo: Bonus Idea
- 5 Trade Ideas for Monday: AbbVie, Airbnb, Affirm, GE Aerospace and Walmart
- Top Trade Ideas for the Week of October 12, 2026: The Rest Premium
- Top Trade Ideas for the Week of October 12, 2026: The Best
- SPY Trends and Influencers October 10, 2026
- Macro Week in Review/Preview October 9, 2026
Archives