4 Trade Ideas for Goldman Sachs: Bonus Idea
- Posted by Greg Harmon
- on October 18th, 2021

Here is your Bonus Idea with links to the full Top Ten:
Goldman Sachs, $GS, topped at the 238.2% extension of the retracement of the pandemic drop in August. It pulled back from there, finding support over the 200% extension and consolidated until a move higher Friday. That took the price over the 50 day SMA and pushed the Bollinger Bands® open. It also made a new short term high. The RSI is rising in the bullish zone with the MACD crossed up and ready to cross to positive.
There is resistance at 415 and 420. Support lower comes at 400 and 390 before 380 and 373. Short interest is low at 1.3%. The stock pays a dividend with an annual yield of 1.97% and has been trading ex-dividend since August 31st. The company just reported earnings and is not expected to report again until mid-January.
The November options chain has biggest open interest at the 385 and 410 strikes on the put side, and at the 410 calls. In the December chain the 410 put is the largest open interest and the the 380 call even bigger. The January chain shows big open interest at the 415, 400 and 370 puts. it is biggest on the clal side in January from 360 to 400.
Goldman Sachs, Ticker: $GS
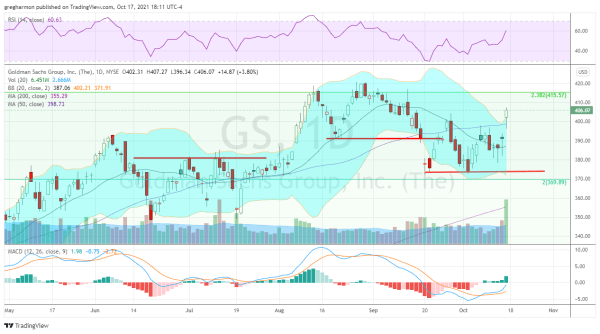
Trade Idea 1: Buy the stock on a move over 408 with a stop at 398.
Trade Idea 2: Buy the stock on a move over 408 and add a November 405/395 Put Spread ($4.15) while selling a November 425 Call ($4.05).
Trade Idea 3: Buy the November/January 425 Call Calendar ($8.20) and sell the November 380 Puts ($3.20).
Trade Idea 4: Buy the January 370/410/430 Call Spread Risk Reversal for 35 cents.
Premium Content
Free Content
If you like what you see sign up for more ideas and deeper analysis using the Get Premium button above.
After reviewing over 1,000 charts, I have found some good setups for the week. This week’s list contains the first five below to get you started early. These were selected and should be viewed in the context of the broad Market Macro picture reviewed Friday which with the October options expiration in the books, saw equity markets showing signs of a rebound from an ugly 10 week stretch.
Elsewhere look for Gold to continue in consolidation while Crude Oil continues in an uptrend. The US Dollar Index continues its short term move to the upside while US Treasuries are in position to possible reverse to the upside. The Shanghai Composite looks to continue the broad drift sideways while Emerging Markets trend lower.
The Volatility Index looks to remain very low making the path easier for equity markets to the upside. The charts of the SPY and QQQ look strong, especially on the longer timeframe where they are showing signs of a resumption of the long uptrend. On the shorter timeframe both the QQQ and SPY still have some work to do but are also looking promising. The IWM however remains in the long consolidation with no signs of that changing. Use this information as you prepare for the coming week and trad’em well.
If you like what you see above sign up for deeper analysis and trading strategy by using the Get Premium button above. As always you can see details of individual charts and more on my StockTwits page.
The information in this blog post represents my own opinions and does not contain a recommendation for any particular security or investment. I or my affiliates may hold positions or other interests in securities mentioned in the Blog, please see my Disclaimer page for my full disclaimer.
blog comments powered by Disqus
-
 Gregory W. Harmon CMT, CFA, has traded since 1986 and held senior positions including Head of Global Trading, Head of Product Development, Head of Strategy and Director of Equity. (More)
 -
Subscribe to Dragonfly Capital Views
Lifetime Subscription
$4,000.00Sign upAnnual Subscription
$1,000.00Sign upQuarterly Subscription
$350.00Sign up
Recent Posts
- 5 Trade Ideas for Monday: AbbVie, Airbnb, Affirm, GE Aerospace and Walmart
- Top Trade Ideas for the Week of October 12, 2026: The Rest Premium
- Top Trade Ideas for the Week of October 12, 2026: The Best
- SPY Trends and Influencers October 10, 2026
- Macro Week in Review/Preview October 9, 2026
- Bull Scan for 10-12-26
- How this Week’s Premium Top 10 Performed, October 9, 2026
- Bull Scan for 10-9-26
- Bull Scan for 10-8-26
- Bull Scan for 10-7-26
Archives