Triangles Don’t End at the Apex
- Posted by Greg Harmon
- on November 8th, 2010
As I was browsing through charts this weekend up popped Joe Donohue’s (@upsidetrader) short post titled Wedges Working. A very simple and great setup that I play often, but it got me thinking about what happens after the wedge or triangle resolves.
Below is a chart for Hi-Tech Pharmacal, a stock I happened to be looking at when that post hit my feed.
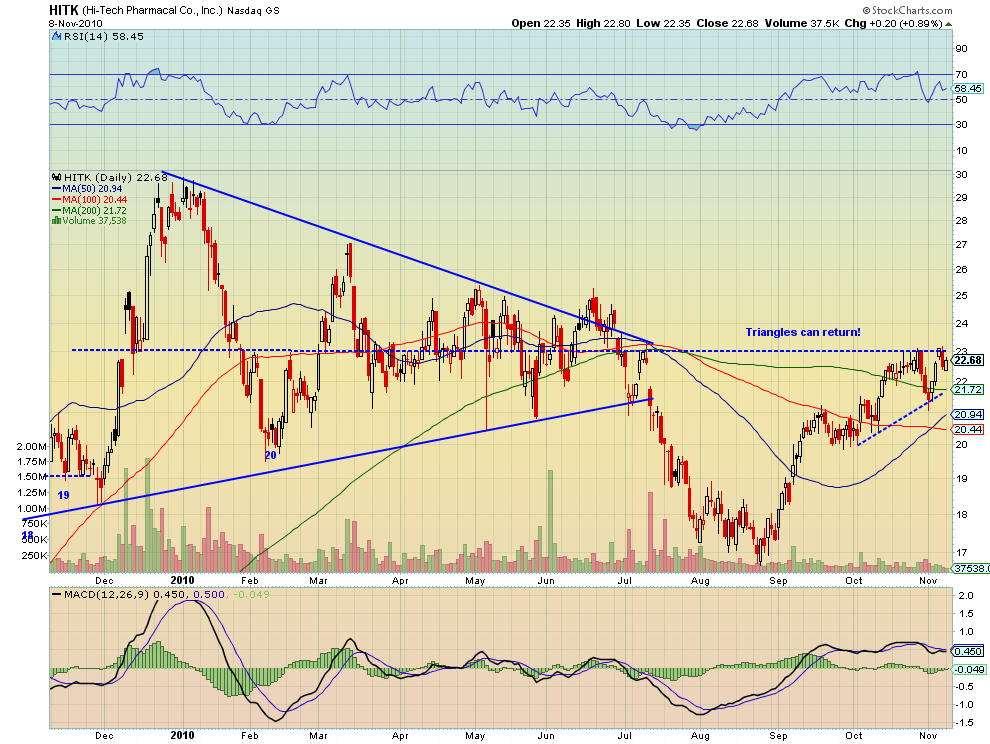
The long symmetrical triangle is prominently displayed in this daily chart. Notice that as triangle moved toward its apex that the price broke down below the triangle in July and then ran lower. Since September it has caught a bid and has been rising with the market. But look what has been happening the last two weeks. The chart below shows a close up since the breakdown.
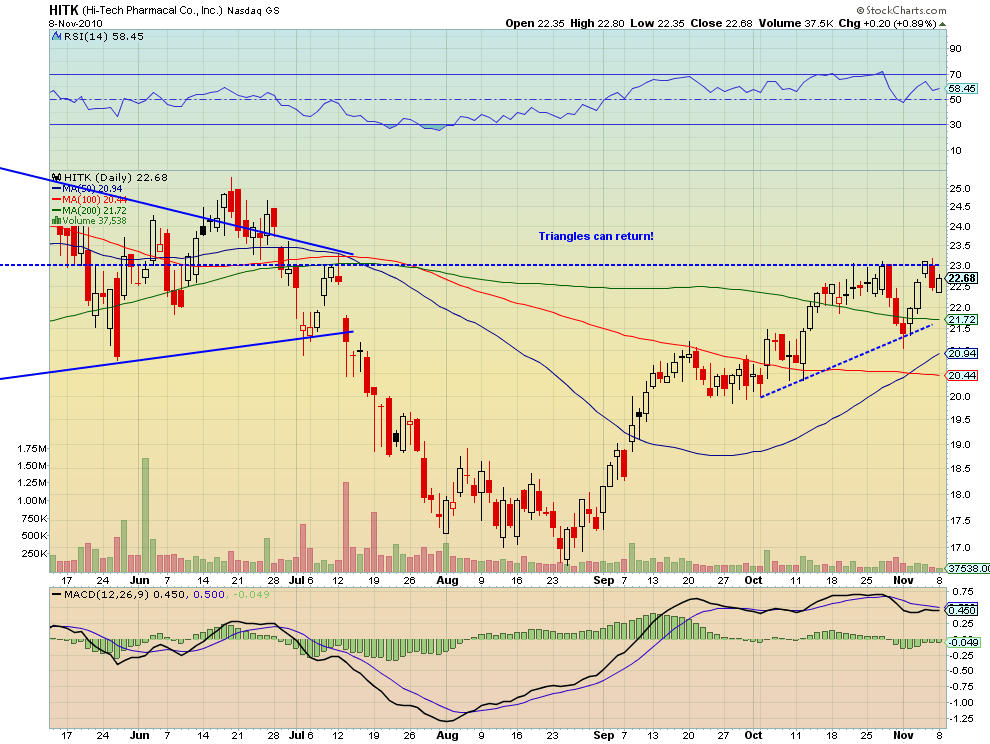
As the price has approached the mid-line of that triangle projected forward, which it left over 3 months ago, it is acting as resistance. This illustrates an important concept in technical analysis. Despite the lack of touches and rejections off of this mid-line while the triangle was resolving, which would be more typical of a support or resistance line, it seems to be important. If you think about it it makes sense. Following the chart from December where the bulls took control and pulled the price higher to January where it started to get dragged down by the bears then back and forth until it finally broke down out of the triangle, the range of motion that each camp could create in the stock was narrowing. And narrowing around this mid-line. So actually there is 7 months of trendline equivalent resistance in this mid-line. No wonder it is still significant. And this holds true for all triangles.
So once the price has broken out of the triangle or wedge, don’t forget that despite what you learned in Geometry, a triangle does not end at the apex.
Trade’m well!
(As always you can see individual charts and more on my twitter feed and on chartly.)
If you like what you see above sign up for deeper analysis and trading strategy by using the Get Premium button above. As always you can see details of individual charts and more on my StockTwits page.
The information in this blog post represents my own opinions and does not contain a recommendation for any particular security or investment. I or my affiliates may hold positions or other interests in securities mentioned in the Blog, please see my Disclaimer page for my full disclaimer.
blog comments powered by Disqus
-
 Gregory W. Harmon CMT, CFA, has traded since 1986 and held senior positions including Head of Global Trading, Head of Product Development, Head of Strategy and Director of Equity. (More)
 -
Subscribe to Dragonfly Capital Views
Lifetime Subscription
$4,000.00Sign upAnnual Subscription
$1,000.00Sign upQuarterly Subscription
$350.00Sign up
Recent Posts
- Bull Scan for 10-14-26
- Premium Earnings 10-13-26: Fastenal and Morgan Stanley
- Bull Scan for 10-13-26
- Premium Earnings 10-12-26: Citigroup and Johnson & Johnson
- 4 Trade Ideas Wells Fargo: Bonus Idea
- 5 Trade Ideas for Monday: AbbVie, Airbnb, Affirm, GE Aerospace and Walmart
- Top Trade Ideas for the Week of October 12, 2026: The Rest Premium
- Top Trade Ideas for the Week of October 12, 2026: The Best
- SPY Trends and Influencers October 10, 2026
- Macro Week in Review/Preview October 9, 2026
Archives