2 Reasons For a Pullback You Didn’t Think of and 1 You Got Wrong
- Posted by Greg Harmon
- on October 7th, 2011
There are so many traders, investors, prognosticators and shams calling for a pullback in stocks that you might think it is almost certain to not happen. One of the major signals has been the relationship between stocks and bonds. The ratio chart below of the S&P 500 SPDR ($SPY) to the iShares Barclays 20+ Year Treasury Bond Fund ($TLT) has been a leading source for the

conviction. The past three days have created a strong upward move and a bullish 3 Advancing White Soldiers candlestick pattern. But it is extended with gaps in the moves higher and smaller real bodies on the advance. A step back also reveals that it is approaching resistance at the top of a downward channel, with a Relative Strength Index (RSI) that has not been bullish since late July. If it can break through the channel and rise higher then perhaps we will get a major move higher. Until then it is suspect. This is the one you have wrong. But there are two other ratio charts that suggest a move lower in the $SPY. The first is the chart of the $SPY vs the iShares MSCI Emerging Markets ETF ($EEM). It shows a strong surge higher through September but is now testing
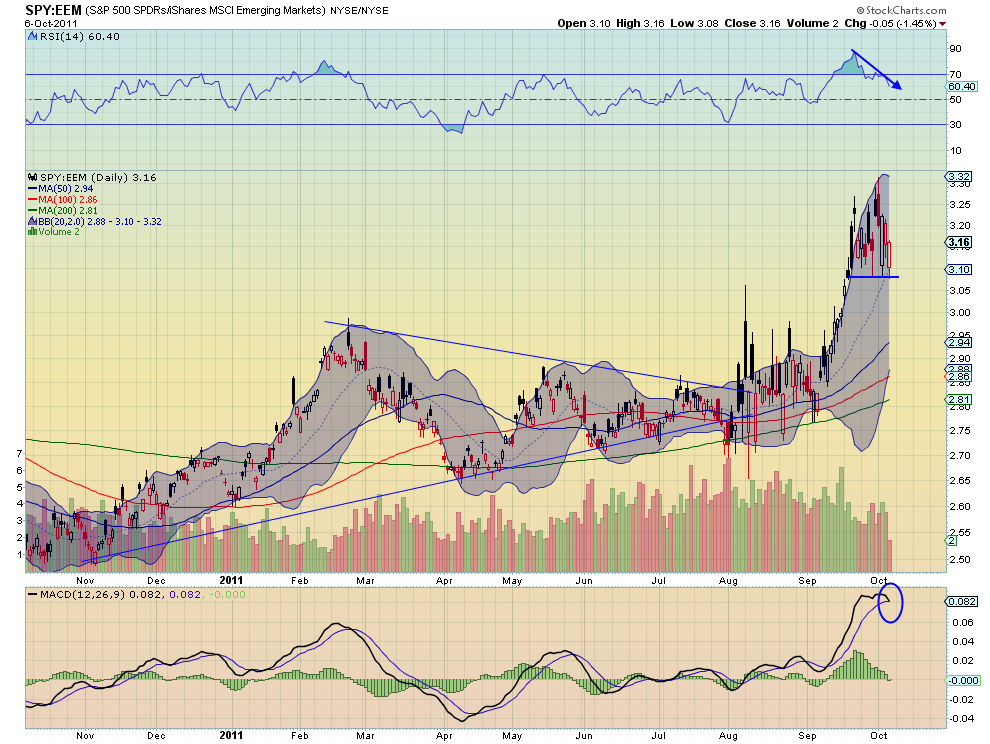
support. As it does so the RSI is trending lower and the moving Average Convergence Divergence (MACD) indicator is about to cross bearishly negative. Both support a break lower. The second is the ratio of the German DAX Composite ($DAX) to the S&P 500 ($SPX). This chart shows a bottom that occurred in early September and it is now in a rising channel. The RSI is also trending higher and the MACD is in strong positive territory. So what does this all mean? Flows from Stocks into
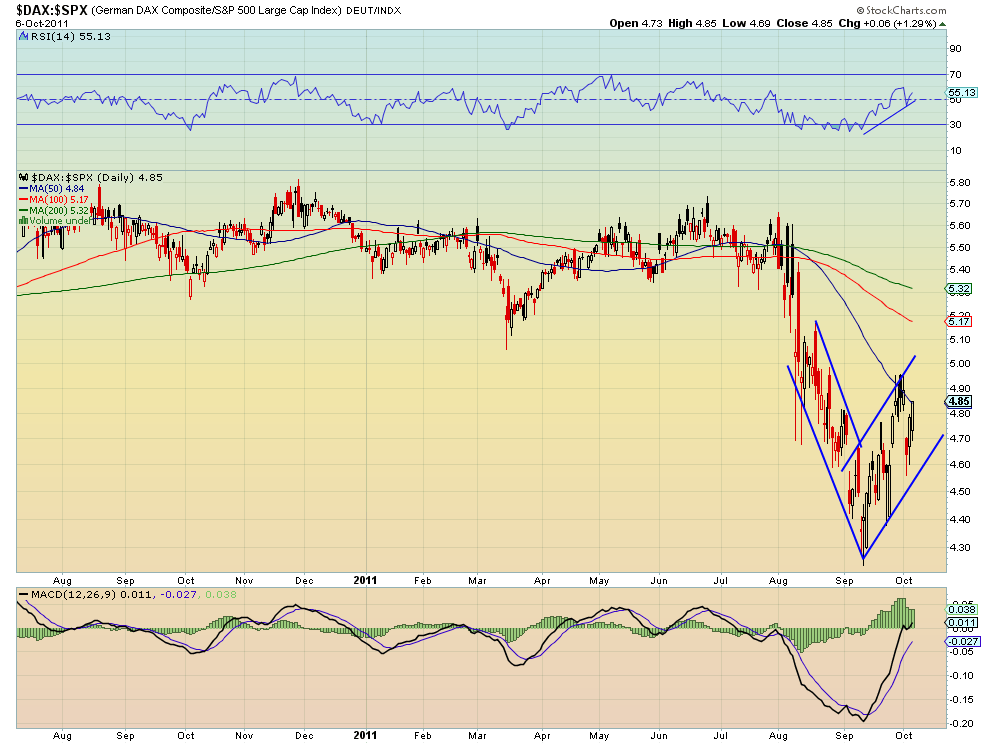
Bonds potentially stalling. Flows from US Equities into Emerging Markets gaining steam. Flows from US Equities into the German (think Europe) Equity market. None of these are good signs for the US Equity Market. We will have to wait and see how this plays out but it is not yet the time to get full on bullish on US Equities.
If you like what you see sign up for more ideas, deeper analysis and trading strategy for these stocks using the Get Premium button above or on the right column. As always you can see details of individual charts and more on my StockTwits feed and on chartly.
If you like what you see above sign up for deeper analysis and trading strategy by using the Get Premium button above. As always you can see details of individual charts and more on my StockTwits page.
The information in this blog post represents my own opinions and does not contain a recommendation for any particular security or investment. I or my affiliates may hold positions or other interests in securities mentioned in the Blog, please see my Disclaimer page for my full disclaimer.
blog comments powered by Disqus
-
 Gregory W. Harmon CMT, CFA, has traded since 1986 and held senior positions including Head of Global Trading, Head of Product Development, Head of Strategy and Director of Equity. (More)
 -
Subscribe to Dragonfly Capital Views
Lifetime Subscription
$4,000.00Sign upAnnual Subscription
$1,000.00Sign upQuarterly Subscription
$350.00Sign up
Recent Posts
- SPY Trends and Influencers October 10, 2026
- Macro Week in Review/Preview October 9, 2026
- Bull Scan for 10-12-26
- How this Week’s Premium Top 10 Performed, October 9, 2026
- Bull Scan for 10-9-26
- Bull Scan for 10-8-26
- Bull Scan for 10-7-26
- Premium Earnings 10-6-26: Constellation Brands
- Bull Scan for 10-6-26
- 5 Trade Ideas for Monday: CIENA, F5, Generac, Goldman Sachs and Marathon Petroleum
Archives