One of These REIT’s is Not Like the Others
- Posted by Greg Harmon
- on February 8th, 2011
Remember watching Sesame Street with your kids (or maybe yourself for you youngsters)? They do this piece with several items and ask your child to pick which is not like the others. The picture below reminded me of that game.

Wow that is quite a picture. It is an ensemble of 12 of the 20 of the charts of the residential REIT’s, taken from Finviz.com. Did you notice how they are all in rising wedges or channels since May with many making new highs (the other 8 are similar by the way)? Oh, except one, Apartment Investment and Management Company (Ticker: AIV). What is wrong with this REIT? Look at the chart in more detail below.
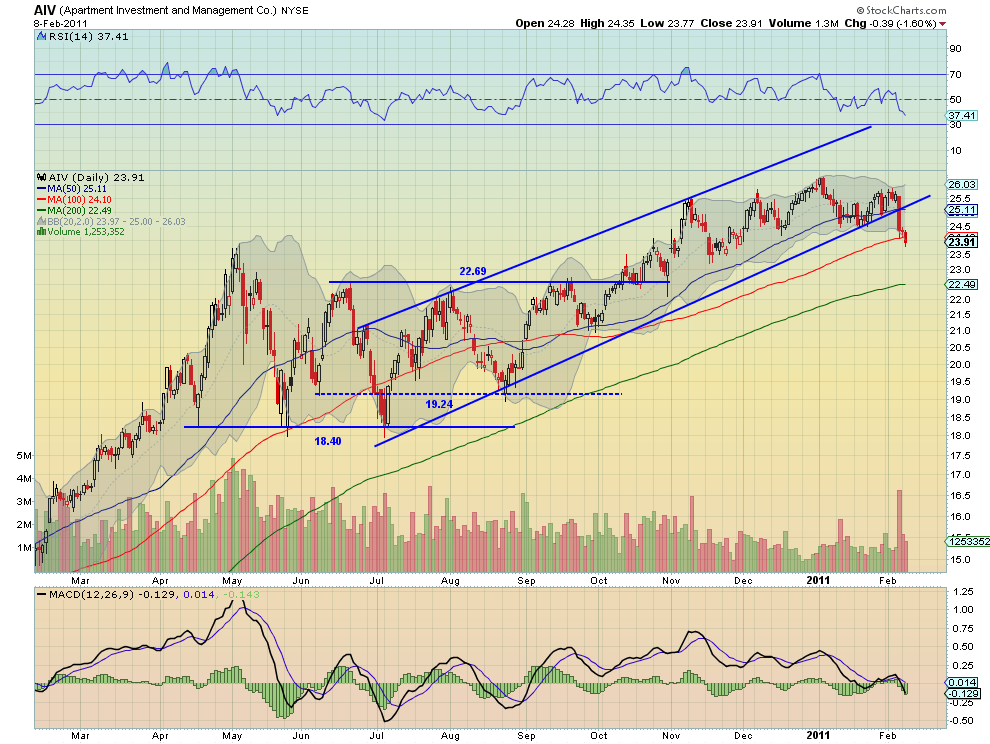
Notice the fall out of the channel Friday. Then after printing a doji on Monday, a possible reversal, continued lower Tuesday. Along the way it has fallen through the 50 and 100 day Simple Moving Averages (SMA). Also the Relative Strength Index (RSI) is heading lower to the technically oversold range and the Moving Average Convergence Divergence (MACD) indicator is getting more negative. Finally you can see that the Bollinger bands are expanding to allow for a run lower. Look for support to hold either at the 23.50 from November or the 22.69 top of the previous consolidation channel. That would be another 5% lower. Is this a buying opportunity or a sign for the future of the sector?
I do not trade off of news but this one struck me as odd so I looked for the news. There was nothing unusual. They reported an earnings loss on February 4 but improved guidance in something called FFO, forecast funds from operations. About half of the sector has reported and this is the only one that looks sick. I will be watching this one for confirmation as the lone wolf or leader of the pack. Trade’m well.
(As always you can see details of individual charts and more on my StockTwits feed and on chartly.)
If you like what you see above sign up for deeper analysis and trading strategy by using the Get Premium button above. As always you can see details of individual charts and more on my StockTwits page.
The information in this blog post represents my own opinions and does not contain a recommendation for any particular security or investment. I or my affiliates may hold positions or other interests in securities mentioned in the Blog, please see my Disclaimer page for my full disclaimer.
blog comments powered by Disqus
-
 Gregory W. Harmon CMT, CFA, has traded since 1986 and held senior positions including Head of Global Trading, Head of Product Development, Head of Strategy and Director of Equity. (More)
 -
Subscribe to Dragonfly Capital Views
Lifetime Subscription
$4,000.00Sign upAnnual Subscription
$1,000.00Sign upQuarterly Subscription
$350.00Sign up
Recent Posts
- Premium Earnings 10-13-26: Fastenal and Morgan Stanley
- Bull Scan for 10-13-26
- Premium Earnings 10-12-26: Citigroup and Johnson & Johnson
- 4 Trade Ideas Wells Fargo: Bonus Idea
- 5 Trade Ideas for Monday: AbbVie, Airbnb, Affirm, GE Aerospace and Walmart
- Top Trade Ideas for the Week of October 12, 2026: The Rest Premium
- Top Trade Ideas for the Week of October 12, 2026: The Best
- SPY Trends and Influencers October 10, 2026
- Macro Week in Review/Preview October 9, 2026
- Bull Scan for 10-12-26
Archives