Measuring Rare Earth Strength – Strong!
- Posted by Greg Harmon
- on April 8th, 2011
Two and a half weeks ago I wrote about Rare Earth Stocks being ready to really ramp up (link below). This was after a 10% percent or more rise that day. Since then they have have been crazy on fire and just not stopping. But just how strong are they relative to the rest of the sector? Let’s look at them relative to the Materials Select Sector SPDR,$XLB. Below is the chart for XLB for reference. Specifically note that it has been in an uptrend since March 15th a full week before the Rare Earth’s blasted off.

Following are ratio charts of three Rare Earth Stocks, Molycorp,$MCP, Rare Element Resources,$REE, and China Shen Zhou Mining & Resources,$SHZ, each against the XLB. On each chart the March 22nd spike is very apparent and ended a downtrend against the sector ETF. But since that spike there have been differences.

MCP has far and away outpaced the others relative to the XLB. It has been a straight trend higher. It is breaking the previous high from January and looks to continue higher. Nothing but strength relative to XLB.
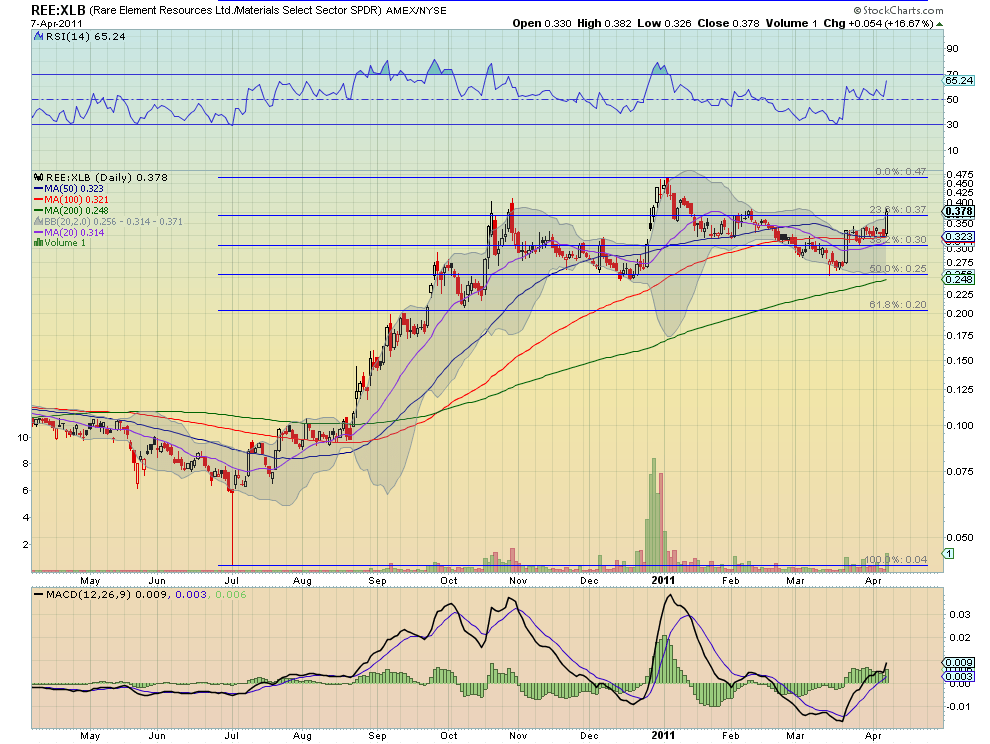
REE went through a sideways consolidation after the initial run higher but Thursday thrust forward again. It is peaking over the top of the Bollinger bands but they are expanding, and there is plenty of room in the RSI for it to continue higher. It is only now moving back through the 23.6% Fibonacci retracement so it has perhaps relatively more potential then the leader MCP.

SHZ was the most beaten up of the 3 relative to the XLB. Perhaps given that it is a Chinese company amidst a wave of frauds. It is still consolidating after the initial move higher, but had a strong relative move Thursday. If it can continue through the cross of the 50 and 100 day SMA’s then it has the best potential for a continued rise relative to the XLB as it has not yet moved back above the 50% retracement level.
All three of these names still have room to run, even within the Materials sector. Which one are you going to buy?
Rare Earth Metals are Out of this World, No Really!
As always you can see details of individual charts and more on my StockTwits feed and on chartly.)
If you like what you see above sign up for deeper analysis and trading strategy by using the Get Premium button above. As always you can see details of individual charts and more on my StockTwits page.
The information in this blog post represents my own opinions and does not contain a recommendation for any particular security or investment. I or my affiliates may hold positions or other interests in securities mentioned in the Blog, please see my Disclaimer page for my full disclaimer.
blog comments powered by Disqus
-
 Gregory W. Harmon CMT, CFA, has traded since 1986 and held senior positions including Head of Global Trading, Head of Product Development, Head of Strategy and Director of Equity. (More)
 -
Subscribe to Dragonfly Capital Views
Lifetime Subscription
$4,000.00Sign upAnnual Subscription
$1,000.00Sign upQuarterly Subscription
$350.00Sign up
Recent Posts
- Bull Scan for 10-13-26
- Premium Earnings 10-12-26: Citigroup and Johnson & Johnson
- 4 Trade Ideas Wells Fargo: Bonus Idea
- 5 Trade Ideas for Monday: AbbVie, Airbnb, Affirm, GE Aerospace and Walmart
- Top Trade Ideas for the Week of October 12, 2026: The Rest Premium
- Top Trade Ideas for the Week of October 12, 2026: The Best
- SPY Trends and Influencers October 10, 2026
- Macro Week in Review/Preview October 9, 2026
- Bull Scan for 10-12-26
- How this Week’s Premium Top 10 Performed, October 9, 2026
Archives