“Market Sentiment is Extremely Bullish, Beware”
- Posted by Greg Harmon
- on January 11th, 2011
What????
Last I checked we were in a bull market, right? And shouldn’t market sentiment be bullish in a bull market? Why does a high level of bullish sentiment equal a pullback? Yes I have heard the pundits talk of studies about how sentiment can be a contrarian indicator, and how extreme readings should bring caution, but come on, it is one indicator. And how often is it contrarian or predictive? Look at the chart below of the last long bull run from 2003 to 2007.
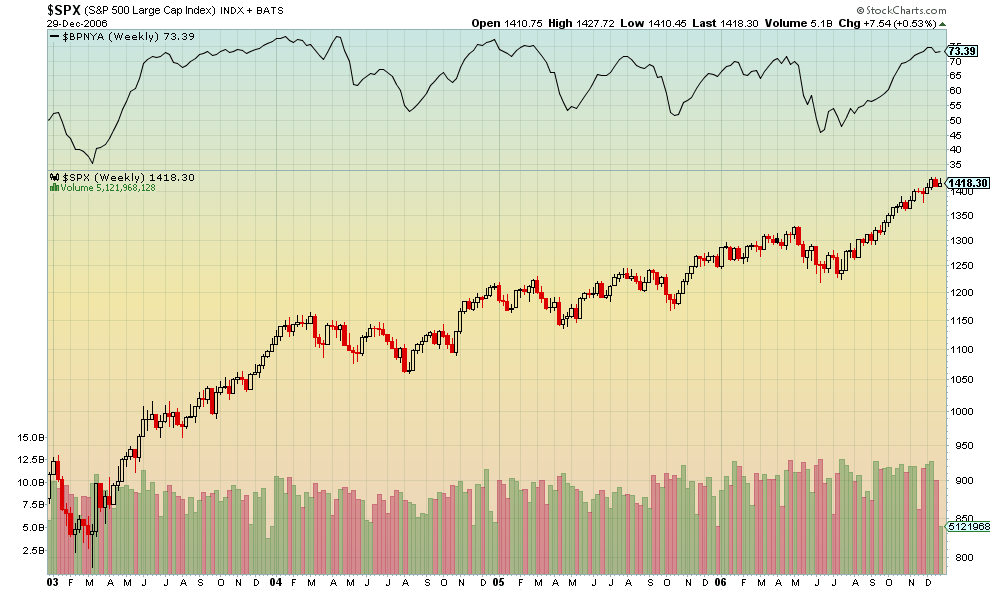
This chart compares NYSE Bullish Percentage Index, BPNYA, in the top panel to the S&P 500 Index in the larger chart for that 4 year bull run. What do you see? BPNYA rose quickly to elevated levels when the market started to run in 2003. Pullbacks in the S&P 500 did happen when the BPNYA was at high levels. And those pullbacks dragged the BPNYA down, but never below 50 except for briefly in 2006. Most interesting for me is that the BPNYA moved in quite a broad range during this bull period between 45 and 80, much like a bullish range on a Relative Strength Index. The dips in sentiment far exceeded the moves in the S&P.
What about in a bear market? Below is the same chart for June 2007 through the March 2009 lows.

Notice any difference in the BPNYA? The range is slightly lower between 25 and 65, but pretty much the same as during the bull run through September 2008. The extreme move down in September 2008 and then again during the extreme move down in February 2009 did bring BPNYA down to extreme lows. Were those extreme lows buying opportunities? The one in March 2009 was but the other would have lost you 25% from 900 down to 666.
Now fast forward to today.

As the S&P rose off of the March 2009 lows BPNYA moved higher quickly and has been back in the previous bullish range between 40 and 80. In fact it has touched over 80 several times, including right now. So is this extreme reading a signal to sell or just the top of the range in a continuing bull market?
So Should I Be Selling Now at the Extreme?
There are many indicators that traders and investors use to try to get an edge, including the BPNYA. But from my unscientific examples above, this indicator travels in a wide range in both bull and bear markets and does not do a good job at predicting the future direction of the market. It is not very useful in and of itself. Let me circle back to unnamed studies above that are often quoted about sentiment being a contrarian indicator. What these studies actually show is the inverse. That at market turning points sentiment indicators did not predict the move. At turning points market sentiment was wrong. Quite different from extreme sentiment levels forecasting a contrarian change in the market. This fits perfectly well with the 3 sample points in our study above, the low BPNYA reading in 2003 before the run higher, the high reading in 2007 before the fall and then again the low reading in 2009 before the current bull run.
The bottom line is that you should use this and other indicators together to paint a picture of the market. But let the price action be the subject of the painting and the indicators the background.
Trade’m well.
If you like what you see above sign up for deeper analysis and trading strategy by using the Get Premium button above. As always you can see details of individual charts and more on my StockTwits page.
The information in this blog post represents my own opinions and does not contain a recommendation for any particular security or investment. I or my affiliates may hold positions or other interests in securities mentioned in the Blog, please see my Disclaimer page for my full disclaimer.
blog comments powered by Disqus
-
 Gregory W. Harmon CMT, CFA, has traded since 1986 and held senior positions including Head of Global Trading, Head of Product Development, Head of Strategy and Director of Equity. (More)
 -
Subscribe to Dragonfly Capital Views
Lifetime Subscription
$4,000.00Sign upAnnual Subscription
$1,000.00Sign upQuarterly Subscription
$350.00Sign up
Recent Posts
- Bull Scan for 10-14-26
- Premium Earnings 10-13-26: Fastenal and Morgan Stanley
- Bull Scan for 10-13-26
- Premium Earnings 10-12-26: Citigroup and Johnson & Johnson
- 4 Trade Ideas Wells Fargo: Bonus Idea
- 5 Trade Ideas for Monday: AbbVie, Airbnb, Affirm, GE Aerospace and Walmart
- Top Trade Ideas for the Week of October 12, 2026: The Rest Premium
- Top Trade Ideas for the Week of October 12, 2026: The Best
- SPY Trends and Influencers October 10, 2026
- Macro Week in Review/Preview October 9, 2026
Archives