Hit the Hanging Man with the Hammer: LQD vs JNK
- Posted by Greg Harmon
- on January 20th, 2011
Below is the ratio chart for the iShares Investment Grade Corporate Bond Fund (Ticker: LQD) against the SPDR Lehman High Yield Bond ETF (Ticker: JNK). Note that it has been in a descending channel since September. This implies that traders are stretching their credit criteria for yield, thus tightening the difference between the two.

During this downward move, the Relative Strength Index (RSI) has maintained a bearish level for the entire run. Currently the RSI is pointing down and the Moving Average Convergence Divergence (MACD) indicator looks like it may cross lower, also bearish. But the ratio also stretched outside of the Bollinger bands today and printed a potentially bullish Hammer candle. This Japanese candlestick pattern with a test lower and then a move back higher can often signal a reversal in a downtrend. Is it set to continue lower or is it ready to reverse, if only for a few days? Let’s dissect it into the two pieces and look at the individual charts. Below is the chart for LQD.
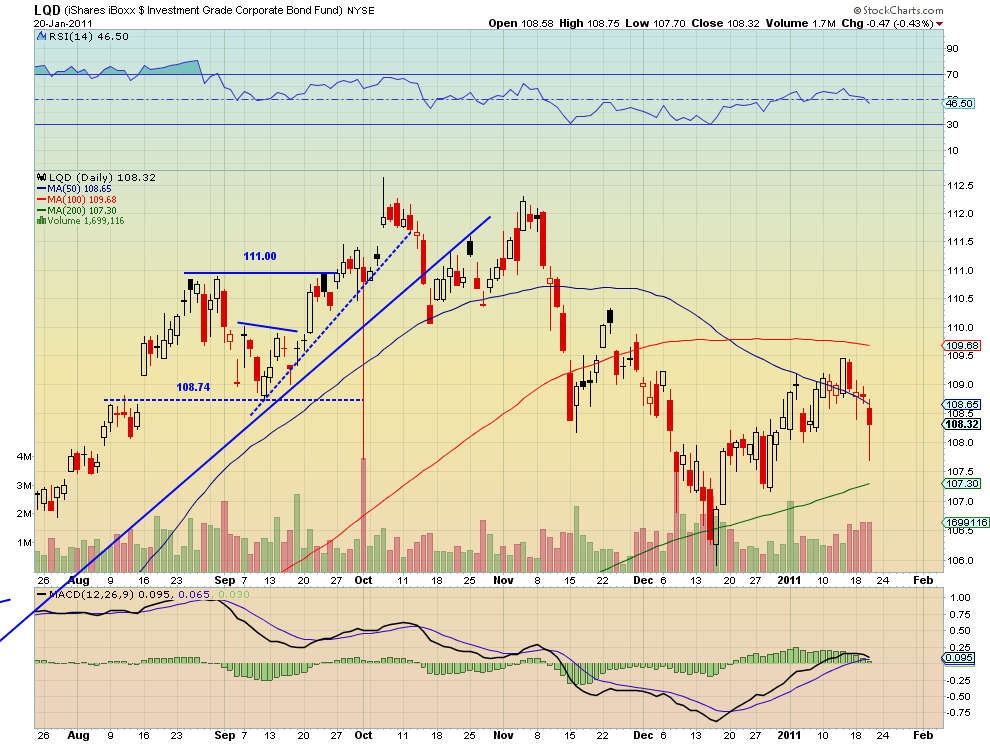
LQD has traded lower over the last few days after a strong run higher. But is also printed a Hammer candle yesterday. The Hammer needs to be confirmed the next day before a trade is entered, but if it is then expect a rise to the 100 day Simple Moving Average (SMA) at 109.68. This is not a given as the MACD is moving lower currently but the RSI is near the mid line where it has recently held. Next look at the chart of the JNK.
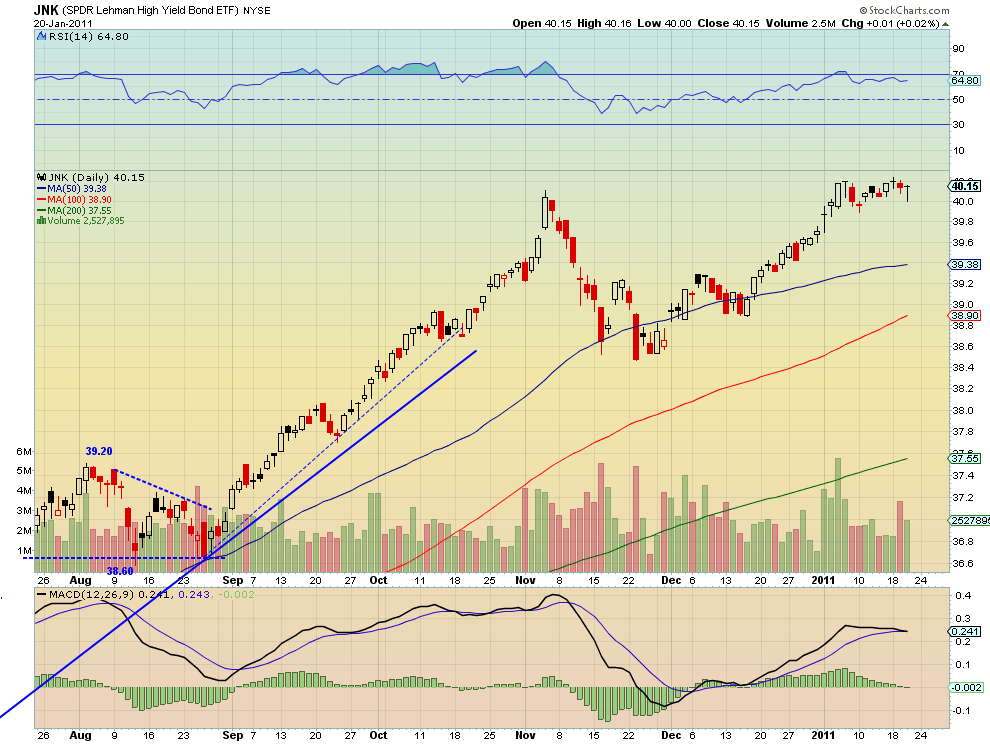
This chart has been hovering near the technically overbought line of RSI at 70 for some time. It has a MACD that is crossing but from a Japanese Candlestick perspective it printed a bearish Hanging Man candle yesterday. Should it be confirmed and fall, there is support at 39.60 and then the 50 day SMA below that at 39.38.
Trade Idea: Long LQD vs Short JNK at a ratio of 2.7:1, with a target of 2.75:1 and a stop at 2.685:1
So from the Japanese Candlestick perspective, assuming confirmation, the reversal in the ratio makes sense, and one could grab the LQD Hammer and know the JNK Hanging Man down off of its perch.
Trade’m well.
(As always you can see details of individual charts and more on my StockTwits feed and on chartly.)
If you like what you see above sign up for deeper analysis and trading strategy by using the Get Premium button above. As always you can see details of individual charts and more on my StockTwits page.
The information in this blog post represents my own opinions and does not contain a recommendation for any particular security or investment. I or my affiliates may hold positions or other interests in securities mentioned in the Blog, please see my Disclaimer page for my full disclaimer.
blog comments powered by Disqus
-
 Gregory W. Harmon CMT, CFA, has traded since 1986 and held senior positions including Head of Global Trading, Head of Product Development, Head of Strategy and Director of Equity. (More)
 -
Subscribe to Dragonfly Capital Views
Lifetime Subscription
$4,000.00Sign upAnnual Subscription
$1,000.00Sign upQuarterly Subscription
$350.00Sign up
Recent Posts
- 5 Trade Ideas for Tuesday: Bank of NY, BorgWarner, Estee Lauder, Intel and Micron Technology
- Top Trade Ideas for the Week of September 8, 2026: The Rest Premium
- Top Trade Ideas for the Week of September 8, 2026: The Best
- SPY Trends and Influencers September 5, 2026
- Macro Week in Review/Preview September 4, 2026
- Bull Scan for 9-8-26
- How this Week’s Premium Top 10 Performed, September 4, 2026
- Bull Scan for 9-4-26
- The World Runs on Oil (Substack repost for Lifetime members)
- Premium Earnings 9-3-26: DocuSign and lululemon
Archives