Buy Costco Over Target
- Posted by Greg Harmon
- on October 4th, 2011
Costco ($COST) and Target ($TGT) have been wandering into each other’s space for years. Costco selling clothes and other items while target expands in groceries. Their charts show that Costco has been the winner over the last year and may be ready to make another move. Lets take a look.
Costco, $COST
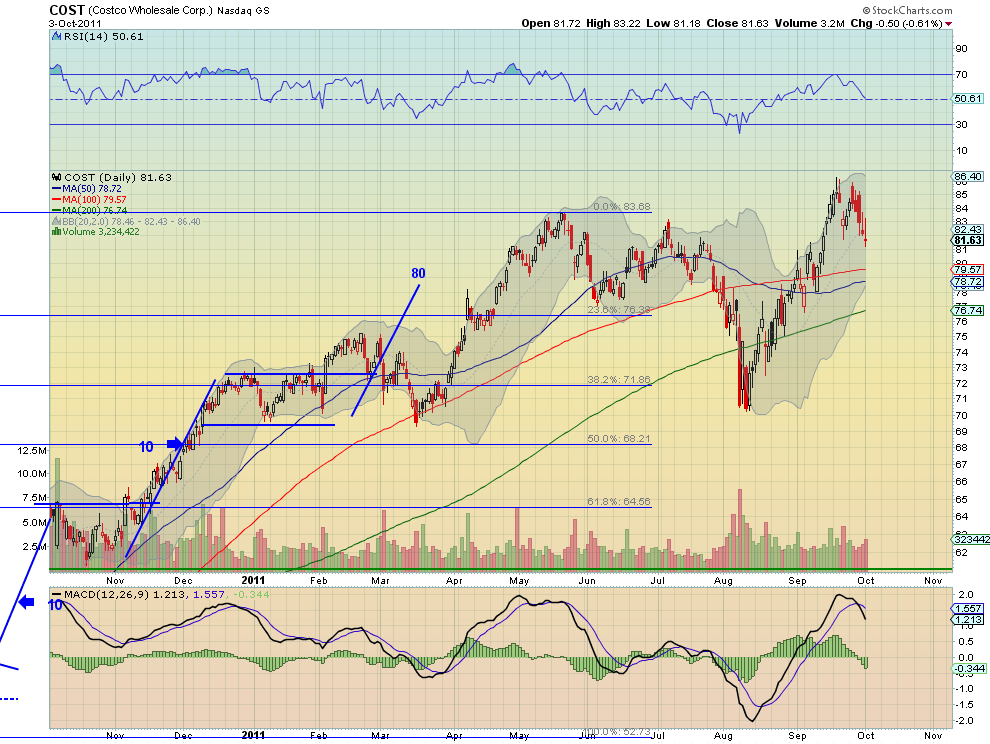
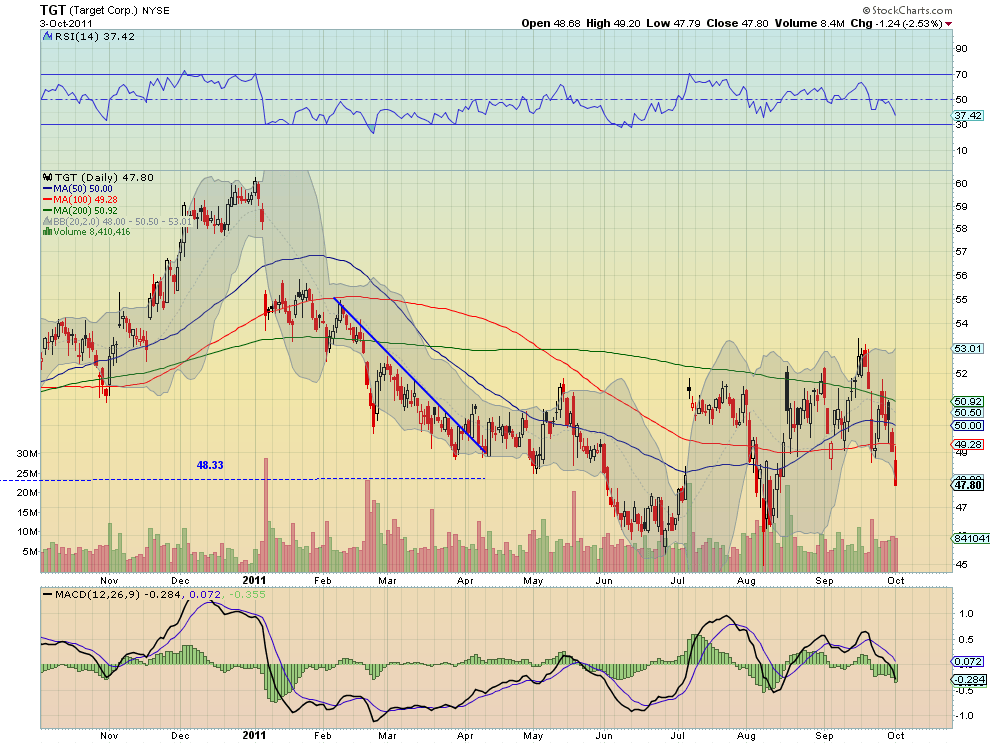
Costco, $COST, has pulled back from a Double Top and has a Relative Strength Index (RSI) that is trying to hold in bullish territory, but with a Moving Average Convergence Divergence (MACD) that is crossed negative and growing. It has printed a couple of reversal signals, a inverted hammer and an doji, the last two days, and has Simple Moving Averages (SMA) that are rising and sloping higher, but it could still move lower. Costco also reports earnings before the market open Wednesday. Target, $TGT, is at least a few steps ahead of Costco, in moving lower. The RSI has moved well into bearish territory and the MACD is growing negative, supporting more downside. It also has the SMA’s sloping lower.
Target, $TGT
The picture gets a lot clearer when you look at a ratio chart of Costco against Target. The series of bull flags is evident in the move from the 1.475 to 1.525 flag up to 1.600, and then the move higher to 1.700. It is now breaking that flag higher and would have a target of 1.800 and resistance at 1.760. The one hesitation about just buying 100 shares of $COST and selling short 170 shares of $TGT is the shooting star doji printed Monday, a potential reversal. If it moves higher Tuesday, failing to confirm, then the trade has a good basis.
$COST vs $TGT
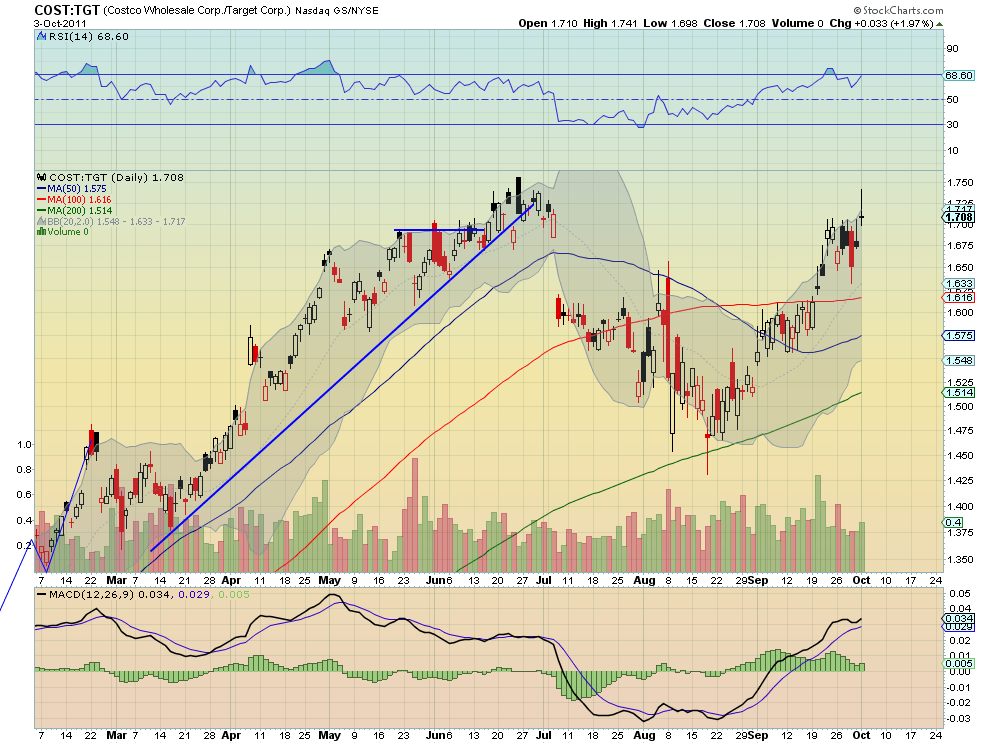
Risking to a ratio of 1.680 and looking for a target of 1.800 this trade has a reward to risk ratio of 3.3:1. Put another way, you risk $134 to make $441 on this trade using 100 shares of $COST and 170 shares of $TGT.
If you like what you see sign up for more ideas and deeper analysis using the Get Premium button above. As always you can see details of individual charts and more on my StockTwits feed and on chartly.
If you like what you see above sign up for deeper analysis and trading strategy by using the Get Premium button above. As always you can see details of individual charts and more on my StockTwits page.
The information in this blog post represents my own opinions and does not contain a recommendation for any particular security or investment. I or my affiliates may hold positions or other interests in securities mentioned in the Blog, please see my Disclaimer page for my full disclaimer.
blog comments powered by Disqus
-
 Gregory W. Harmon CMT, CFA, has traded since 1986 and held senior positions including Head of Global Trading, Head of Product Development, Head of Strategy and Director of Equity. (More)
 -
Subscribe to Dragonfly Capital Views
Lifetime Subscription
$4,000.00Sign upAnnual Subscription
$1,000.00Sign upQuarterly Subscription
$350.00Sign up
Recent Posts
- SPY Trends and Influencers October 10, 2026
- Macro Week in Review/Preview October 9, 2026
- Bull Scan for 10-12-26
- How this Week’s Premium Top 10 Performed, October 9, 2026
- Bull Scan for 10-9-26
- Bull Scan for 10-8-26
- Bull Scan for 10-7-26
- Premium Earnings 10-6-26: Constellation Brands
- Bull Scan for 10-6-26
- 5 Trade Ideas for Monday: CIENA, F5, Generac, Goldman Sachs and Marathon Petroleum
Archives