Top 10 Trade Ideas for the Week of October 11, 2010
- Posted by Greg Harmon
- on October 9th, 2010
After looking at over 500 charts and posting my thoughts on many of them, I have found some good setups for the week. This week’s list contains 7 long ideas, 1 short setup and three breakout plays. These were selected and should be viewed in the context of the broad market trend, reviewed Friday, which looks to bring stronger prices for Gold and Crude Oil with the US Dollar Index weak and looking lower. Bonds look to continue their drift higher until some catalyst sparks a move. The Volatility Index may finally be breaking its channel lower adding to the bullish case for the equity Index ETF’s. The Equity Index ETF’s for the second week in a row look stronger on a weekly time-frame than on the daily charts, so a pullback could occur on the way higher. Sector analysis shows that the most bullish sectors, Materials, Energy, Industrials and Consumer Discretionary suggest a topping of the economy but this reality is being masked by the weakening dollar bringing into question how long a rally can continue. I detailed this in my dragonflycap.com and @harmongreg on twitter.
Here are the top ten for the week in alphabetical order:
1. Peabody Energy, Ticker: BTU

Peabody is at the Fibonacci resistance level of 51.76. If it can get though it to the upside then there is resistance at 55 followed by 60.25. Support comes at 50, and then 48.74 lower if it rejects the level. The Relative Strength Index (RSI) looks positive and the Moving Average Convergence Divergence (MACD) indicator is positive adding to the possibility of a run higher.
2. Cognex, Ticker: CGNX
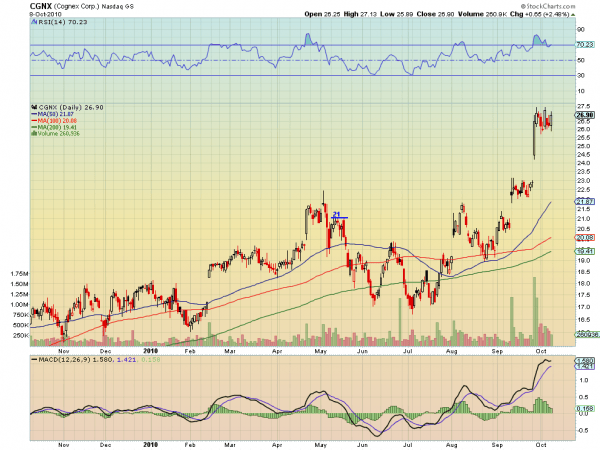
Cognex is waving a bullish Flag after gapping higher. If it can break above 27.50 then the target on the move is 31.50. It has been working off an overbought RSI and may be ready soon. Watch for support at 26. If that fails there is an opportunity to the downside to support at 24.50, the start of the gap, and then 23.
3. Cliffs Natural Resources, Ticker: CLF

Cliffs is trending higher in a rising wedge and through the recent high of 69. It is now ready to test resistance at the top of the channel at 75. A rising RSI and MACD support a continued run. Ca-ching!
4. Delcath Systems, Ticker: DCTH
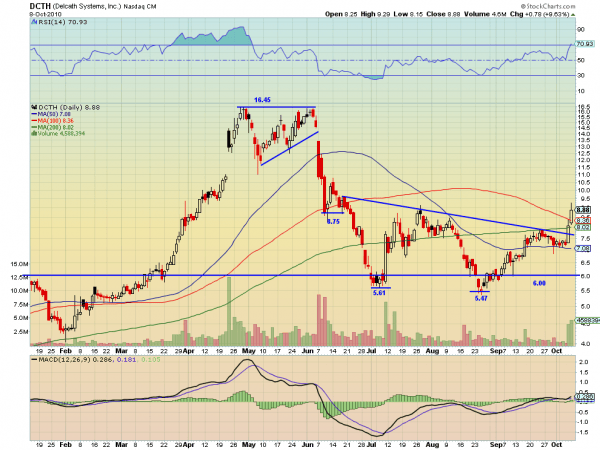
Delcath broke out of a descending triangle on big relative volume. This is the kind of break out to get excited about. It is now heading to resistance at 9.50 with 10.50 above that. The RSI and MACD are increasing adding to the bull case. There is support near at 8.36.
5. Dendreon, Ticker: DNDN
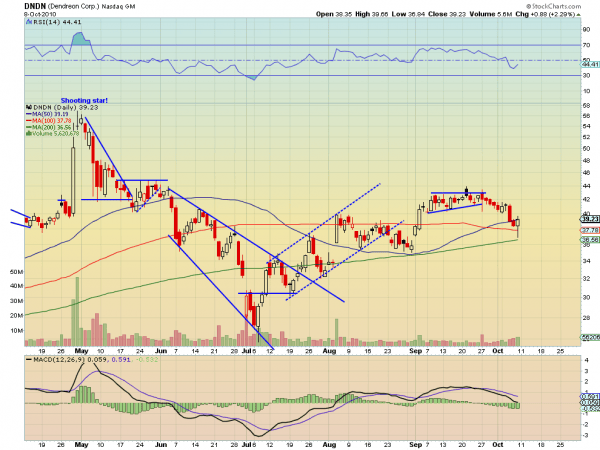
Dendreon printed a big juicy bullish Hammer candle on Friday. After testing the 200 day SMA, it rose back through the 100 day and 50 day SMA’s to close above all 3, and the mid-August resistance area. It looks ready to head higher to resistance at 40.45 with 43 above that. The SMA’s will act as support. RSI turned up and the MACD indicator is waning.
6. DirecTV, Ticker: DTV
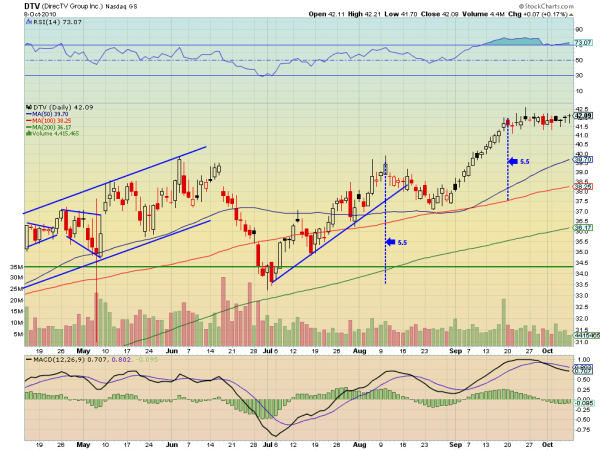
DirecTV has put in a two week bull flag after running higher. If it can get above 42.50 it should run up again with a target of 48. The RSI is starting to rise again and the MACD is waning, both clues it may move soon. Support on a failure can be found at 41.50.
7. Newcastle Investment, Ticker: NCT
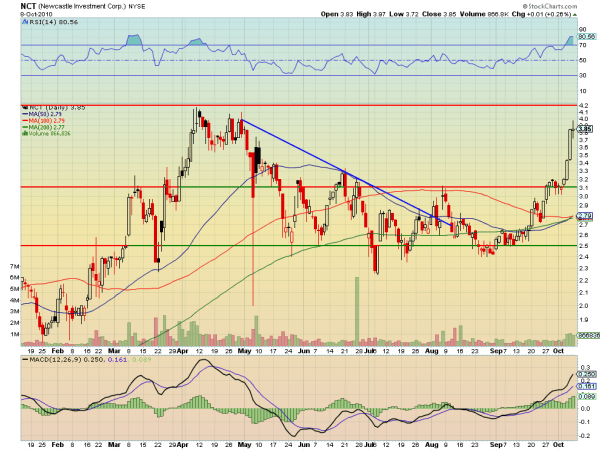
Newcastle printed a Long Legged doji on Friday after a great run higher, signaling indecision. If it decides to move higher then there is resistance at 4.20. On the other hand, if it decides to reverse there is support at 3.45. There is opportunity either way! I like it higher.
8. Power-One, Ticker: PWER
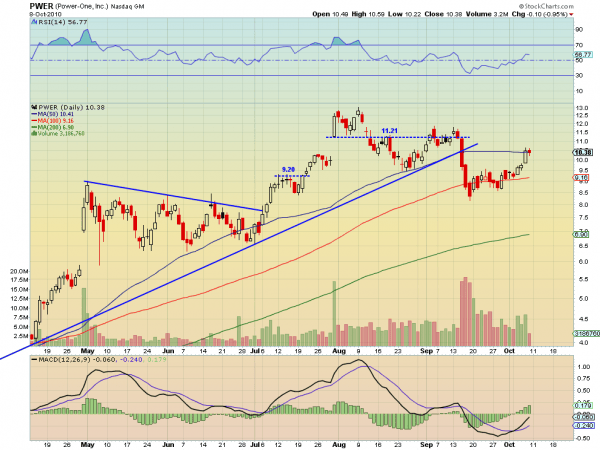
Two weeks ago a poster child, now higher after a bounce. Power-One is testing resistance at 10.41. If it can get through then 11.21 and 11.60 are the next resistance levels. If not then there is support at 9.50 followed by 9.16.
9. STEC, Ticker: STEC
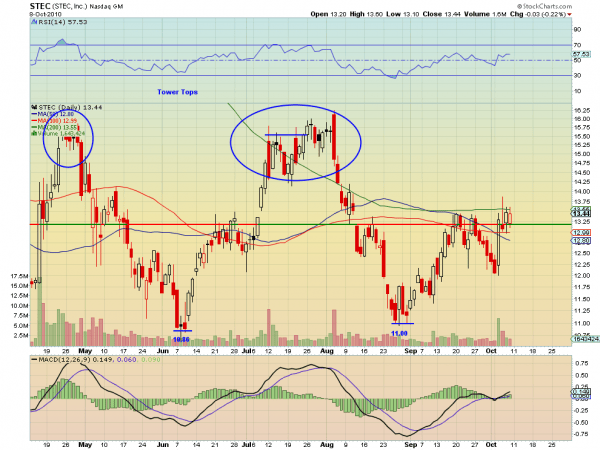
STEC is printing a bull flag resting on the support/resistance line of 13.20. If it can get above the 200 day SMA at 13.55, then it can run to resistance at 14 and then 14.75. The MACD is increasing and RSI support a move higher.
10. Under Armour, Ticker: UA
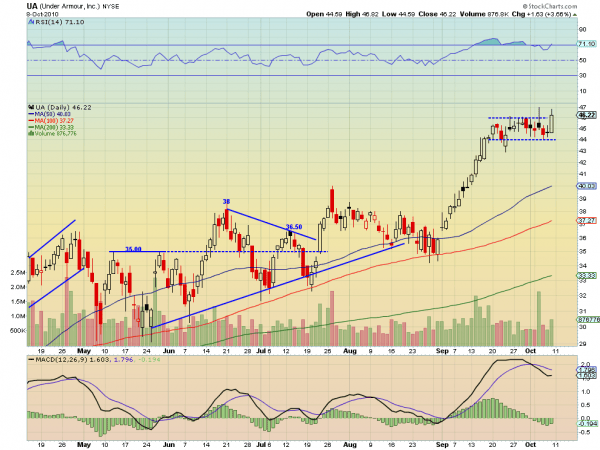
Under Armour broke out of a bull flag Friday on increasing volume. Measuring the move before the flag gives a target of 53. Notice that the RSI is moving up and the MACD is growing less negative. The two sides of the flag at 46 and 44 will provide support on a pullback.
Bonus Idea: American Express, Ticker: AXP
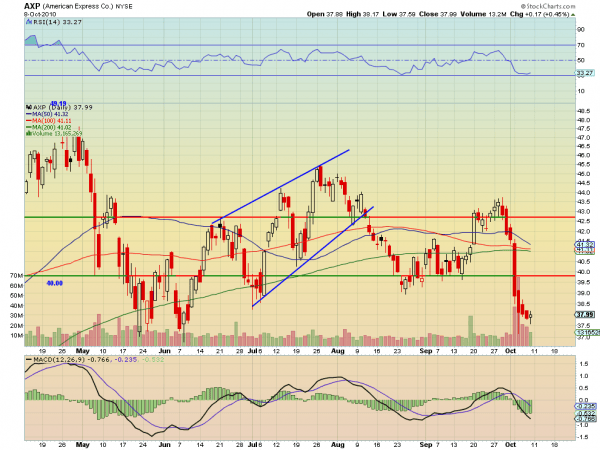
American Express is in a Bear Flag after a big fall. The SMA’s are starting to roll lower and the MACD and RSI suggest more downside as well. Below 37.50 there is support at 33. Above resistance at 38.50 could signal a reversal.
Trade’m well!
If you like what you see above sign up for deeper analysis and trading strategy by using the Get Premium button above. As always you can see details of individual charts and more on my StockTwits page.
The information in this blog post represents my own opinions and does not contain a recommendation for any particular security or investment. I or my affiliates may hold positions or other interests in securities mentioned in the Blog, please see my Disclaimer page for my full disclaimer.
blog comments powered by Disqus
-
 Gregory W. Harmon CMT, CFA, has traded since 1986 and held senior positions including Head of Global Trading, Head of Product Development, Head of Strategy and Director of Equity. (More)
 -
Subscribe to Dragonfly Capital Views
Lifetime Subscription
$4,000.00Sign upAnnual Subscription
$1,000.00Sign upQuarterly Subscription
$350.00Sign up
Recent Posts
- SPY Trends and Influencers September 12, 2026
- Bull Scan for 9-14-26
- Macro Week in Review/Preview September 11, 2026
- How this Week’s Premium Top 10 Performed, September 11, 2026
- What About Bond Futures
- Bull Scan for 9-11-26
- Premium Earnings 9-10-26: Adobe and Oracle
- Bull Scan for 9-10-26
- Premium Earnings 9-9-26: Macy’s
- Bull Scan for 9-9-26
Archives