Naming My Own Price on Priceline
- Posted by Greg Harmon
- on October 5th, 2011
Priceline.com ($PCLN) is another example of the high flying momentum drive stocks that is up like a bazillion percent over the last 3 years. But I am ready to name my own price at 393, at least in the short run, and put money on it to lock it in. Let me explain. Below is the daily chart for Priceline.com. After the long run higher it has been consolidating over the 445 support level that has been important several times since March. Tuesday it broke that level on its recent run lower but printed a potential bullish reversal candle, a Hammer. This needs to be confirmed by a higher

close Wednesday to get long. But look at the other indicators. The Relative Strength Index (RSI) is trolling on the bottom and the Moving Average Convergence Divergence (MACD) indicator is growing more negative. Both support more downside. The picture gets clearer when looking at the weekly chart. The RSI has been trending lower and the MACD growing negative here as well.
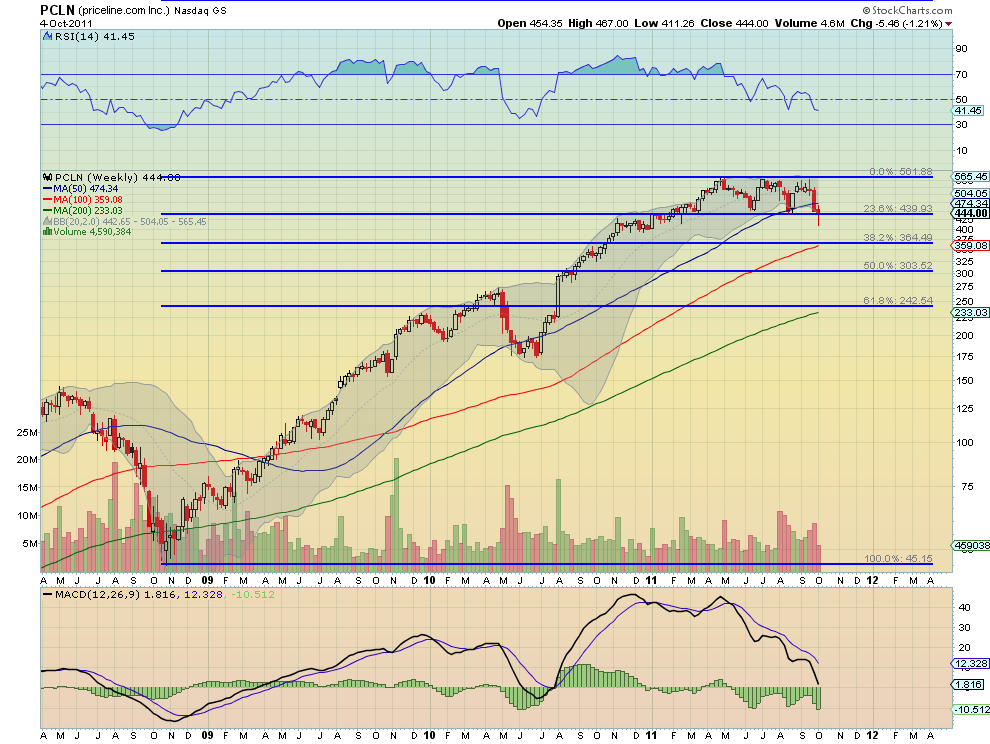
Looking at the Fibonacci levels, 440 is a 23.6% retracement of the move higher and a break would suggest a move toward 384.49, the 38.2% retracement. But back on that daily chart there is a gap to be filled at 393, hence my call.
Trade Idea: Buy 1×2 October Put Spread 420×395/385
Buy the October 420 Strike Put and Sell both the October 395 Strike put and the October 385 Strike Put. This gives upside of $25 on a close below 395 on October Expiry. If the stock closes below 385 then you will be put the stock, but with a 360 basis, and can sell for a profit immediately as long as it stays above 360. I offered this trade Tuesday when it was trading at a 40 cent credit, but not the analysis. Near Tuesday’s close it was offered for $2.60. Keep an eye on it and look for a credit and a close under 445 to get in.
If you like what you see sign up for more ideas and deeper analysis using the Get Premium button above. As always you can see details of individual charts and more on my StockTwits feed and on chartly.
If you like what you see above sign up for deeper analysis and trading strategy by using the Get Premium button above. As always you can see details of individual charts and more on my StockTwits page.
The information in this blog post represents my own opinions and does not contain a recommendation for any particular security or investment. I or my affiliates may hold positions or other interests in securities mentioned in the Blog, please see my Disclaimer page for my full disclaimer.
blog comments powered by Disqus
-
 Gregory W. Harmon CMT, CFA, has traded since 1986 and held senior positions including Head of Global Trading, Head of Product Development, Head of Strategy and Director of Equity. (More)
 -
Subscribe to Dragonfly Capital Views
Lifetime Subscription
$4,000.00Sign upAnnual Subscription
$1,000.00Sign upQuarterly Subscription
$350.00Sign up
Recent Posts
- Bull Scan for 9-9-26
- Premium Earnings 9-8-26: Chewy
- 4 Trade Ideas for Johnson & Johnson: Bonus Idea
- 5 Trade Ideas for Tuesday: Bank of NY, BorgWarner, Estee Lauder, Intel and Micron Technology
- Top Trade Ideas for the Week of September 8, 2026: The Rest Premium
- Top Trade Ideas for the Week of September 8, 2026: The Best
- SPY Trends and Influencers September 5, 2026
- Macro Week in Review/Preview September 4, 2026
- Bull Scan for 9-8-26
- How this Week’s Premium Top 10 Performed, September 4, 2026
Archives